Figure 6.
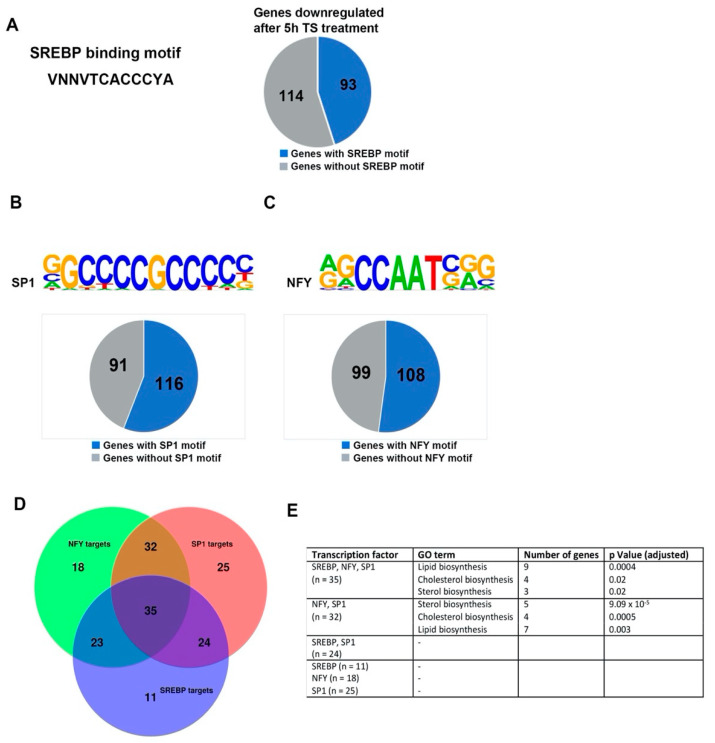
Analysis of transcription factor binding in mTORC1 inhibited neurons. (A) Pie chart of the genes downregulated after 5 h temsirolimus treatment, which contain SREBP binding sites in their promoters. For SREBP binding site identification, the software findM was used. (B,C) Pie charts of the genes which were downregulated after 5 h temsirolimus treatment and contained SP1 (B) or NF-Y (C) binding sites in their promoters. The software HOMER v4.9 was used to screen the promoters of the downregulated genes for the presence of transcription factor binding sites. (D) Venn diagram depicting downregulated genes that share binding sites for two or three of the transcription factors SREBP, SP1, and NF-Y in their promoters. (E) GO term analysis of the genes which contain different combinations of transcription factor binding sites in their promoters.

