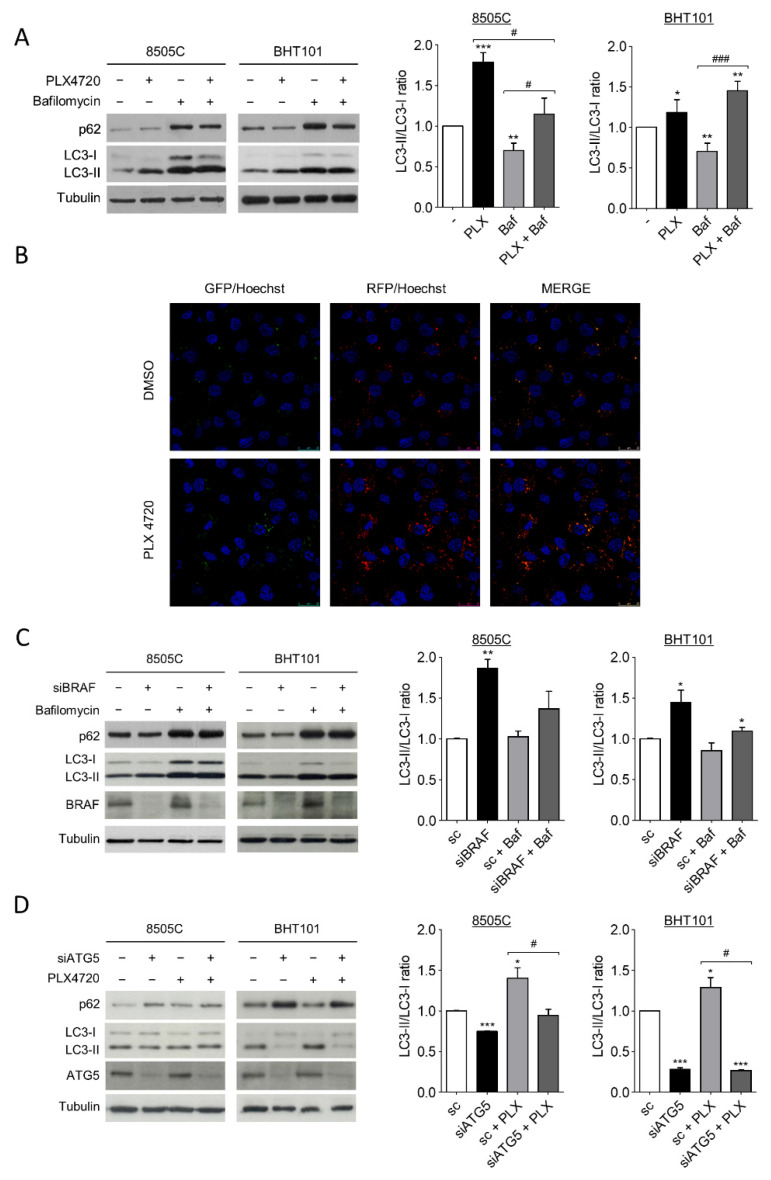
Figure 1.
V600EBRAF inhibition induces autophagy in thyroid cancer cells. (A) LC3 and p62 protein levels (left blots), and quantitative analysis of LC3-II/LC3-I ratios (right graphs) in cells incubated for 24 h with DMSO (-) or PLX4720 (PLX), in the absence or presence of Bafilomycin A1 (Baf). (B) Immunofluorescence in 8505C cells transiently transfected with the mRFP/GFP-LC3 (ptfLC3) plasmid for 48 h, and then treated with DMSO or PLX4720 for 24 h. Autophagosomes are identified by yellow puncta (green and red) and autolysosomes by “red only” puncta. Nuclei were labelled with Hoechst dye. Scale bar is 25µm. (C) LC3, p62 and BRAF protein levels (left blots), and quantitative analysis of LC3-II/LC3-I ratios (right graphs) in cells transfected with either an oligo control (sc) or specific siRNA for BRAF (siBRAF) for 72 h, and treated with Bafilomycin A1 for the last 24 h. (D) LC3, p62 and ATG5 levels (left blots), and quantitative analysis of LC3-II/LC3-I ratios (right graphs) in cells transfected with an oligo control (sc) or with specific siRNA for ATG5 (siATG5) for 48 h, and then left untreated or treated with PLX4720 for 24 h. For each experiment, membranes were reprobed with anti-β-Tubulin as a loading control. Graphic bars represent the LC3-II/LC3-I ratio, calculated after quantitation of LC3-II and LC3-I bands of the blots, and are presented as fold induction relative to the untreated cells. Blots are from one representative experiment and data shown represent the mean ± SEM of the quantitation of at least three independent experiments performed with similar results. Significant differences compared to the corresponding controls: * 0.01 < p < 0.05, ** 0.001 < p < 0.01, *** p < 0.001, compared to untreated cells; # 0.01 < p < 0.05, ### p < 0.001, compared to Bafilomycin A1 treatment.

