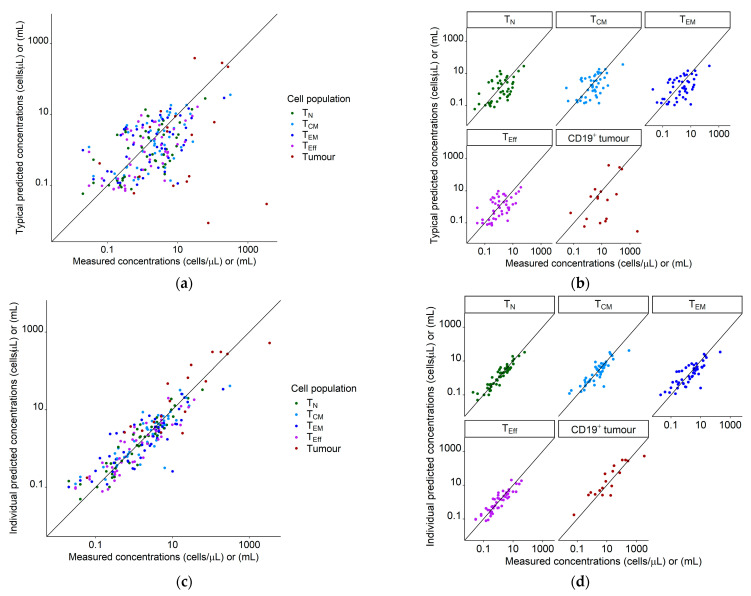
Figure 2.
Goodness of fit plots for the population quantitative systems pharmacology model using our clinical dataset of 19 patients. Legend: (a) Typical predictions (not considering interindividual variability) vs. measured concentrations/volumes for all species; (b) typical predictions (not considering interindividual variability) vs. measured concentrations/volumes, stratified for species; (c) individual predictions vs. measured concentrations for all species; (d) individual predictions vs. measured concentrations, stratified for species. Diagonal line: Line of identity. Tumor measurements marked as a complete response were set to a value of 0 mL and are not shown. Abbreviations—TN: naïve T cells, TCM: central memory T cells, TEM: effector memory T cells, TEff: effector T cells, CD19+ tumor: CD19+ metabolic tumor volume.

