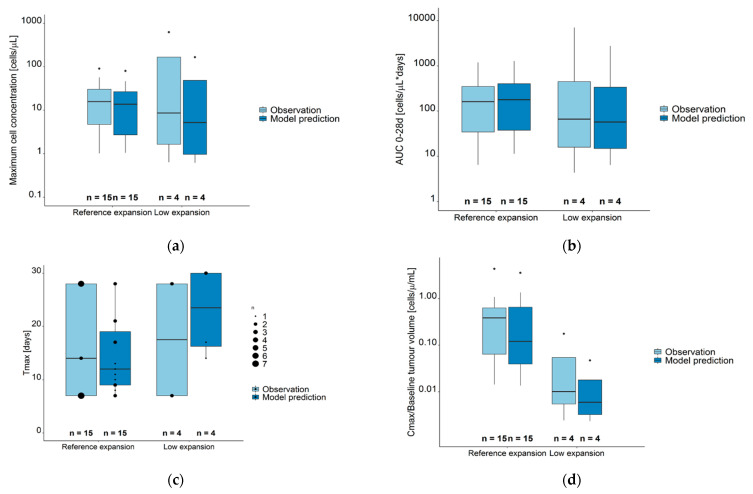
Figure 5.
Observed (light blue boxes) and model predicted (dark blue boxes) CAR-T cell kinetic parameters for the sum of all CAR-T cell populations. (a) Maximum cell concentration (Cmax). (b) Area under the concentration–time curve from day 0–28 (AUC0–28d). (c) Time at maximum concentration (days); data points of differences sizes mark the number of observations/predictions at different time points. (d) Cmax/Baseline metabolic tumor volume (cells µL−1 mL−1). Legend—Boxes: interquartile range (IQR) including median; whiskers: range from hinge to lowest/highest value within 1.5 IQR; points: data outside whisker. Abbreviations—Tmax: time at maximum CAR-T cell concentration; AUC 0–28d: area under the concentration–time curve from days 0–28, Cmax: maximum CAR-T cell concentration.

