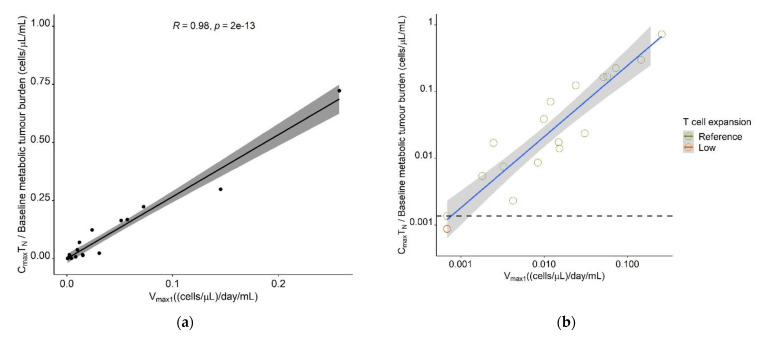
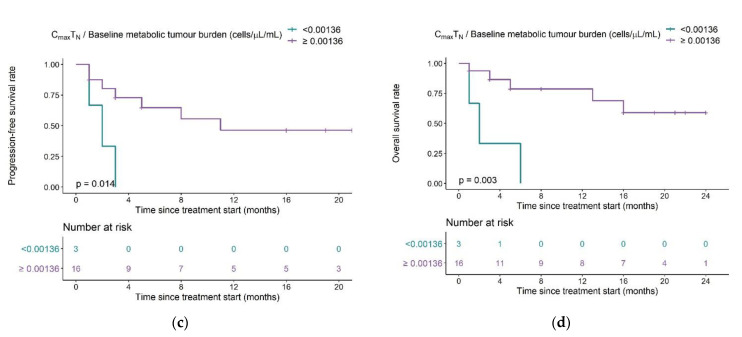
Figure 9.
Determination of a clinical composite score (CCS) cut-off value for early response-prediction. (a) Correlation between model parameter Vmax1 ((cells·µL−1)·day−1·mL−1) and CCS Maximum naïve CAR-T cell concentration/Metabolic tumor volume at baseline ((cells·µL−1) ·mL−1). (b) Correlation plot as A but on a log-log scale and different labeling of the T cell expansion subpopulation. The dashed horizontal line marks the CCS cut-off value most predictive for allocation to the low expansion subpopulation, as determined using ROC analysis. (c) Kaplan–Meier probabilities for progression-free survival in patients below or exceeding the determined CCSTN cut-off value. (d) Kaplan–Meier plots for overall survival in patients below or exceeding the determined CCSTN cut-off value. Abbreviations—CCSTN: clinical composite score for naïve CAR-T cells.


