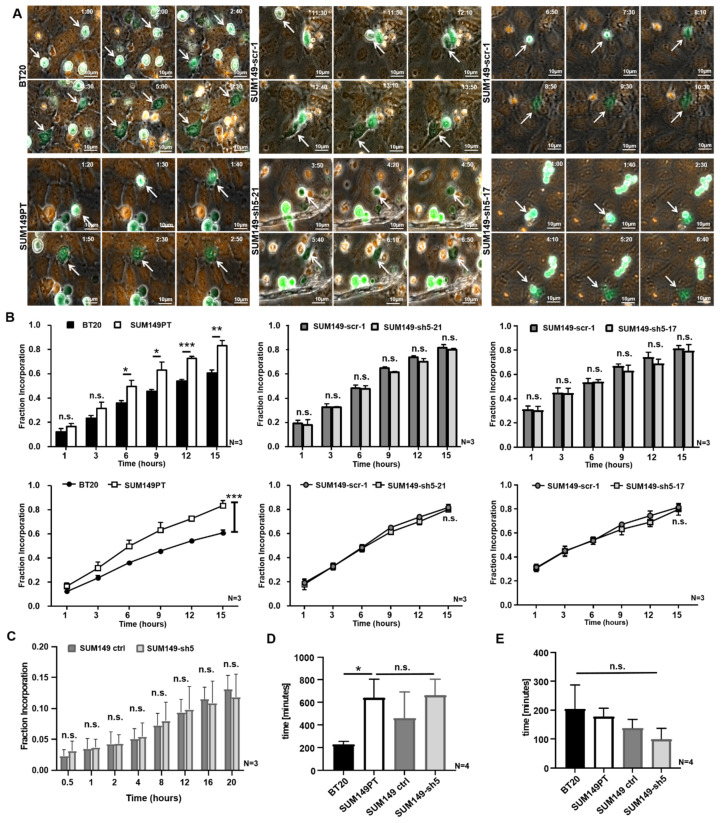
Figure 3.
The incorporation of SUM149 cells into the HUVEC monolayer is VE-cadherin independent. 50,000 tumor cells (green) were stained with CellTracker Green and placed on a confluent HUVEC monolayer (orange), fluorescently labeled with CellTracker Orange. The incorporation was recorded over 15 h with a microscope focused on the HUVEC monolayer. (A) The BT20, SUM149PT, SUM149-scr-1, SUM149-sh5-21 and SUM149-sh5-17 cells (white arrows) moved into the focus plane of HUVEC and incorporated into the endothelium. 40x magnification. Time in h:min after the beginning of the experiment is indicated; (B) Fraction of Incorporation at 1, 3, 6, 9, 12 or 15 h after the start of experiment; (C) 20,000 tumor cells were placed on a HUVEC monolayer, and their incorporation was recorded over 20 h with microscope focus on the HUVEC plane. Fraction of Incorporation 0.5, 1, 2, 4, 8, 12, 16 and 20 h after the start of the experiment; (D) Incorporation inception times do not depend on VE-cadherin as analyzed by live cell imaging (E) Duration of incorporation is VE-cadherin independent as calculated by live cell imaging. Bars represent standard deviation; n.s. not significant, * p ≤ 0.05; ** p ≤ 0.01; *** p ≤ 0.001; statistical analysis was conducted using one-way and two-way ANOVA.

