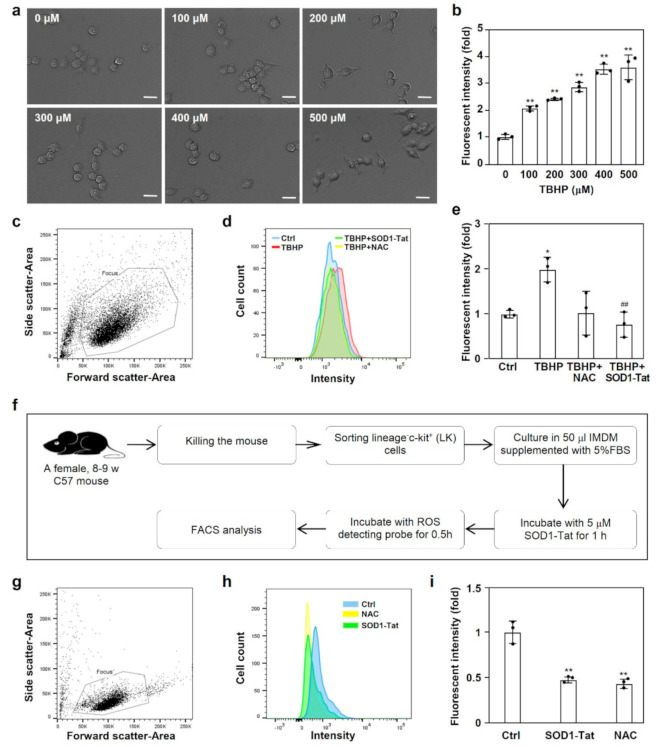
Figure 2.
The antioxidant activity of the SOD1-Tat fusion protein. (a). Morphology of RAW264.7 cells challenged with tert-butyl hydroperoxide (TBHP) at different concentrations. Bars represent the length of 20 μΜ. (b). TBHP treatment increased the ROS levels in RAW264.7 cells. RAW264.7 cells were challenged with different concentrations of TBHP. The ROS level was measured by flow cytometry with a DCFHDA probe of the CellROX® green assay kit. *: p < 0.05; **: p < 0.01, versus the control group. (c–e). SOD1-Tat pretreatment restrained ROS production in RAW264.7 cells challenged with TBHP. RAW264.7 cells were pretreated with 5 μΜ SOD1-Tat, 1 mM N-acetyl-L-cysteine (NAC), or PBS for 0.5 h. Then, 100 μΜ TBHP was added for another 0.5 h. The ROS level was measured by flow cytometry with a DCFHDA probe. The RAW264.7 cell population was selected by gating physical characteristics (c). Histogram of the fluorescence intensity of ROS in RAW264.7 cells (d). Blue line, control group; red line, TBHP group; green line, TBHP+SOD1-Tat group; yellow line, TBHP+NAC group. ROS production in RAW264.7 cells was quantitated according to the ratio of fluorescence intensity in the experimental versus control groups (e). Results are presented as mean ± SD and represent three independent experiments (n = 3). *, p < 0.05, versus control group; ##, p < 0.01, versus TBHP group. (f). Flow chart for the detection of ROS. LK cells were sorted from isolated TBM cells and cultured in 50 μL IMDM containing 5% FBS. After incubation with 5 μΜ SOD1-Tat, 1 mM NAC, or PBS for 1 h, the ROS level was measured by flow cytometry with a DCFHDA probe. (g–i). SOD1-Tat treatment decreased ROS production in LK cells. The live cell population was selected by gating physical characteristics (g). Histogram of the fluorescence intensity of ROS in LK cells (h). Blue line, control group; green line, SOD1-Tat group; yellow line, NAC group. ROS production in LK cells was quantitated according to the ratio of fluorescence intensity in the experimental versus control groups (i). Results are presented as mean ± SD, and represent three independent experiments (n = 3). **, p < 0.01, versus control group.

