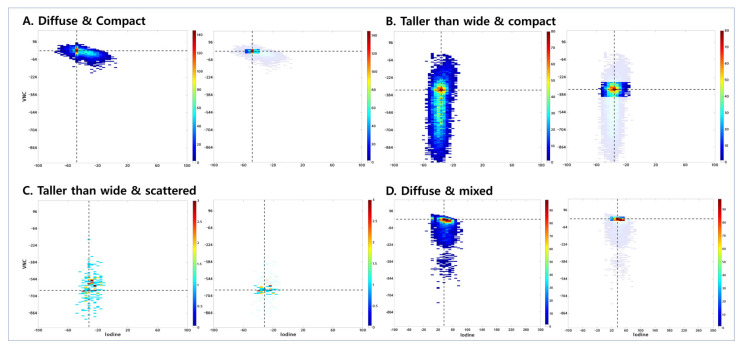
Figure 1.
Joint histogram of VNC and iodine map. (A) A 62-year-old male patient with solid predominant type invasive adenocarcinoma. The joint histogram graph is shown on the left with the transverse axis as iodine histogram attenuation scale and the longitudinal axis as VNC histogram scale. The shape of intensity value pairs is diffuse, and the distribution is compact. The VNC group is within the high group. On the right, the graph shows the localized area that contains 30% of the total distribution around the cross-point value (area 30). Area 30 is compact. (B) A 62-year-old male patient with pure-acinar type invasive adenocarcinoma. The shape of the intensity value pairs is taller than wide, and the distribution is compact. The VNC group is within the intermediate group, and area 30 is diffuse. (C) A 62-year-old female patient with pure-lepidic type adenocarcinoma in situ (AIS). The shape of intensity value pairs is taller than wide, and the distribution is scattered. The VNC group is within the low group and area 30 is diffuse. (D) A 46-year-old male with papillary-predominant type invasive adenocarcinoma. The shape of intensity value pairs is diffuse, and the distribution is mixed. The VNC group is within the high group, and area 30 is compact.

