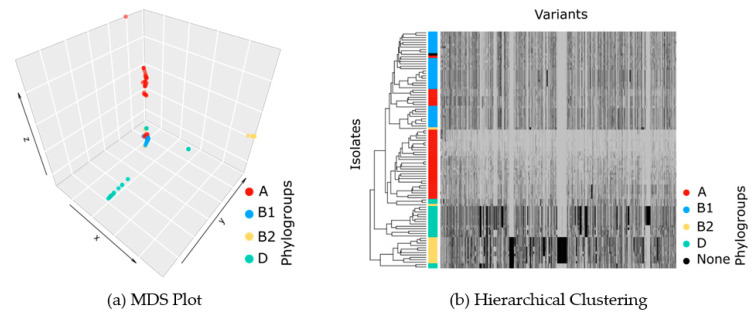
Figure 3.
(a) Multidimensional scaling plot (MDS) on distances between isolates, calculated based on high-dimensional vectors of all mutations. Four clusters are found, which reflect the population structure in the GWAS model and which broadly coincide with phylogroups A, B1, B2, and D. (b) Hierarchical clustering on the vectors of presence/absence of variants for different isolates, where the presence of a variant is shown by black and its absence by gray.

