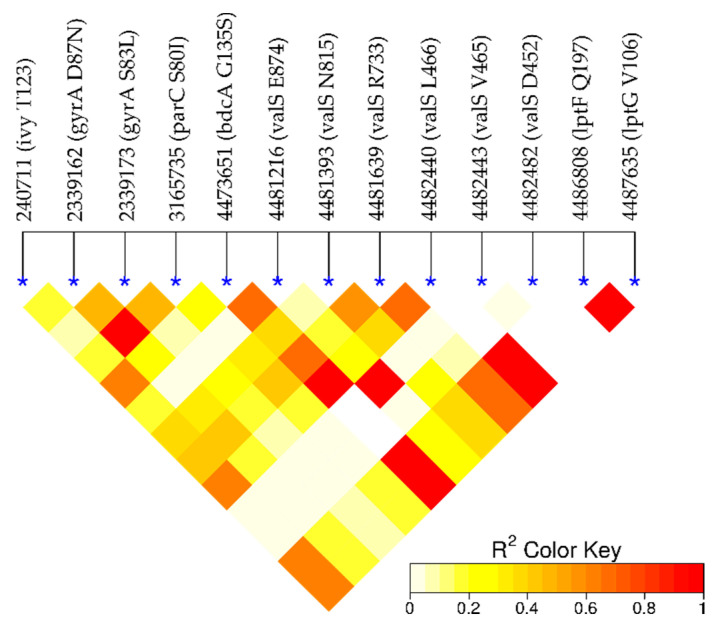
Figure 5.
Linkage disequilibrium (LD). High values (red) indicate a dependence of the loci. As expected, the loci in gyrA and parC are in linkage disequilibrium. Importantly, they are not in LD with the remaining novel candidate loci. Interestingly, there is some dependence within the novel loci, in particular, the locus in bdcA is in LD with the loci in valS.

