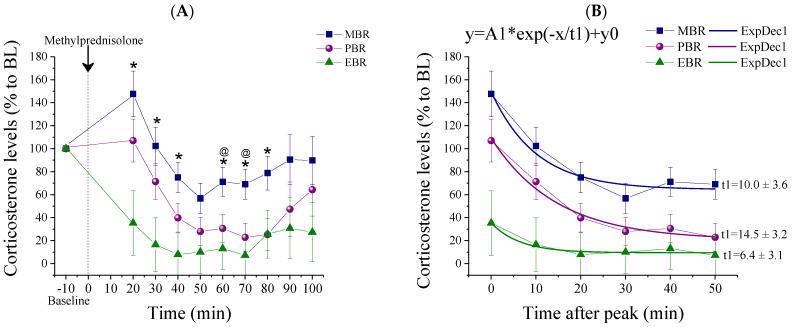
Figure 3.
Corticosterone measurements post-MPST. Corticosterone measurements following MPST depicted as percentages from the baseline between the different CBC groups. (A) Measurements starting at 10 min before methylprednisolone injection (baseline) and 20 min after methylprednisolone injection, at 10 min intervals over a period of 90 min, points are averaged within each group (* MBR ≠ EBR, p < 0.04; @ MBR ≠ PBR p < 0.05; mean ± SEM). (B) A nonlinear fitting decay model carried out on the 6 time points following corticosterone peak concentrations indicated significantly different decay constants (t1) between groups, such that EBR rats exhibited a slower decay in corticosterone levels than MBR and PBR rats.

