Figure 6.
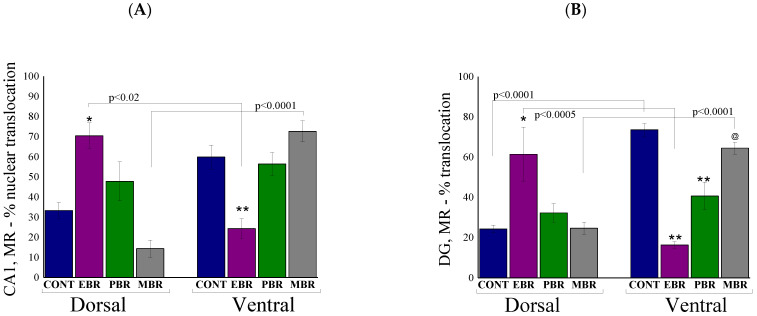
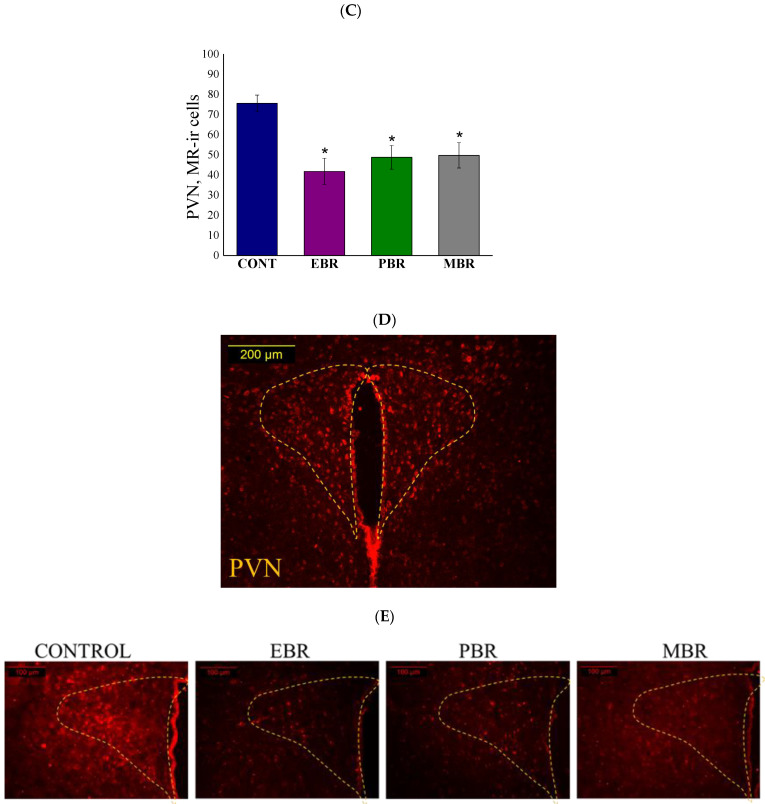
Brain MR-ir cells 8 days post-PSS exposure. Immunohistochemistry of MR in specific brain areas 8 days post-PSS exposure. Significant differences between dorsal and ventral parts are depicted in the graphs, whereas notations are given for significant differences between groups in the same area and explained in this legend for each graph separately. (A) MR-IR in the CA1 region of the ventral and dorsal hippocampus [* significant as compared to dorsal control and MBR (p < 0.03); ** significant as compared to ventral control and MBR (p < 0.045)]. (B) MR-IR in the ventral and dorsal dentate gyrus [* significant as compared to dorsal control, PBR and MBR (p < 0.02); ** significant as compared to ventral control (p < 0.001); @ significant as compared to ventral EBR and PBR (p < 0.02)]. (C) MR-IR in the PVN [* significant compared to control (p < 0.015)]. Panel (D) shows a schematic drawing of the regions of the PVN from which the measurements were collected. The image was acquired at 10× magnification. Scale bar: 200 μm. Additionally, in (E), there are representative images of MR-immunoreactivity in the PVN region of CONT, EBR, PBR, and MBR groups. Images were acquired at 20× magnification. Scale bar: 100 μm. The cells in red are MR-positive.


