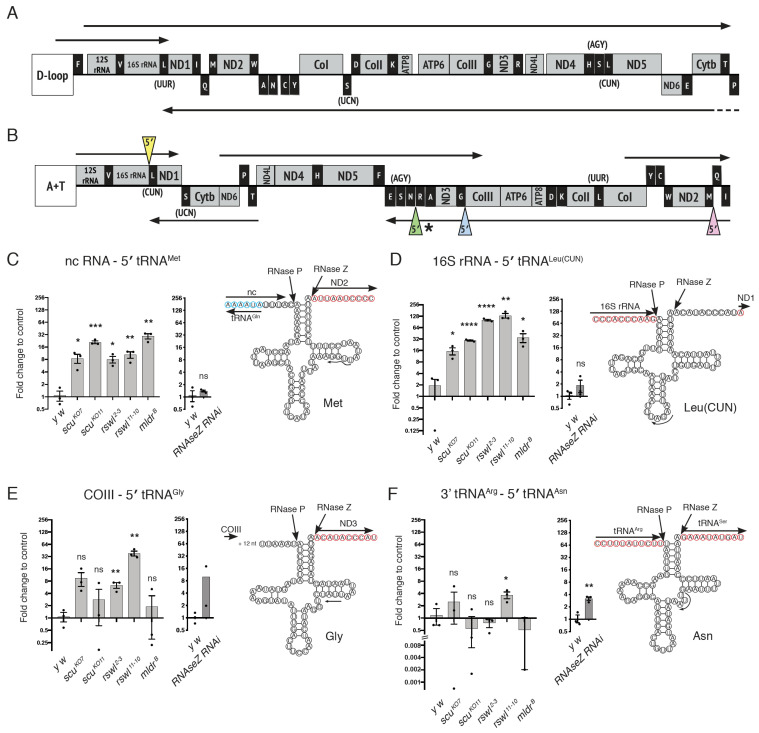
Figure 3.
Mutations in mtRNase P complex proteins differentially affect mt:tRNA 5′-end processing. (A,B) Linear schematic of human (A) and Drosophila (B) circular mtDNA. Protein coding regions (mRNA) and ribosomal RNA (rRNA) are depicted in grey, whereas mt:tRNAs are in black. Both mtDNAs encode the same products in a slightly different order. Arrows indicate polycistronic transcripts, with humans containing three and Drosophila, five. The non-coding regions that control replication (human and Drosophila) and transcription (human) are the displacement (D) loop and the A+T region that is rich in adenine and thymine. The mt:tRNA 5′-ends tested are indicated with colored triangles (B). The asterisk indicates a junction that could also be recognized and cleaved at the mt:tRNA 3′-end. (C–F) Graphs representing the log2 fold change in qPCR levels and the corresponding predicted mt:tRNA cloverleaf structure for mt:tRNA 5′-end canonical junctions between (C, pink triangle) non-coding (nc) RNA: 5′ tRNAMet; (D, yellow triangle) 16S rRNA: 5′ tRNALeu(CUN); (E, blue triangle) COIII: 5′ tRNAGly; (F, green triangle) 3′ tRNAArg: 5′ tRNAAsn for scu, rswl, mldr, and UAS-RNaseZ RNAi mutant larvae. The arrow within each tRNA diagram indicates the internal primer start site for qPCR analysis. The red circled nucleotides represent 5′ -> 3′ mtRNA, and the blue represents mt:tRNA encoded on the opposite strand. Bars on the graphs represent averaged 2^ddCt, and the y-axis is log2. Further explanation can be found in the materials and methods. The statistical significance was calculated relative to control (y w). Error bars: S.E.M. calculated using GraphPad PRISM using an unpaired t-test, one-tailed. * p < 0.05; ** p < 0.01; *** p < 0.001; **** p < 0.0001; ns: not significant.

