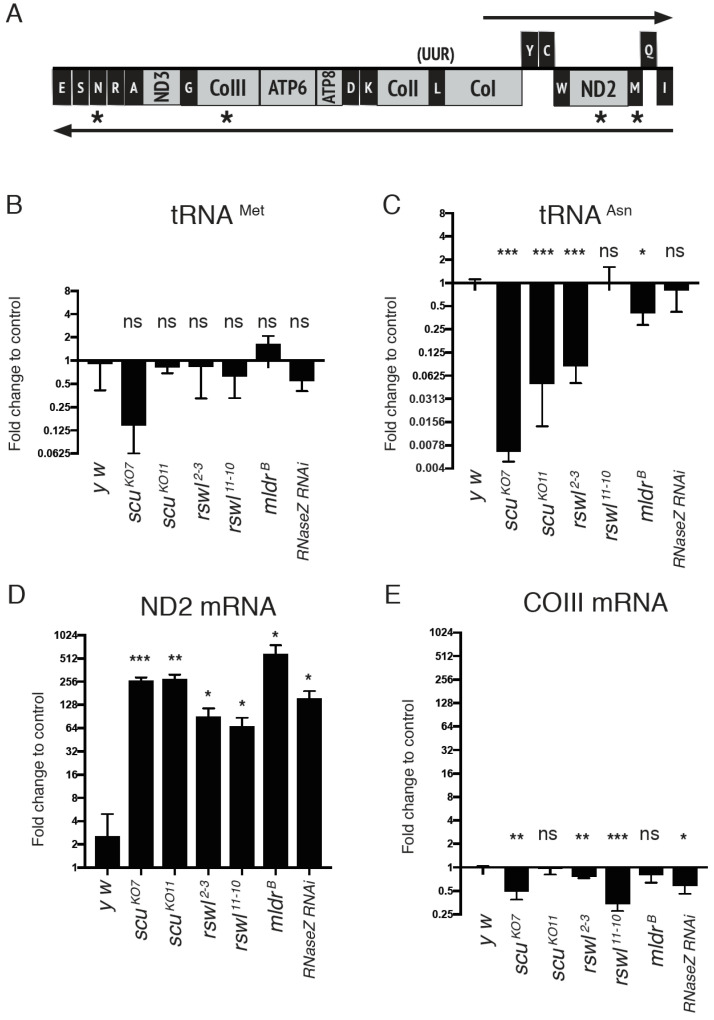
Figure 5.
Steady state levels of mt:tRNAs and mt:mRNAs in mtRNase P mutants. (A) Graph of the analyzed mtRNA species (asterisks) located on the same polycistronic transcript. The graphs represent the log2 fold change in the steady-state amounts of mt:tRNAMet (B), mt:tRNAAsn (C), ND2 mRNA (D), and COIII mRNA (E) in scu, rswl, mldr, and RNaseZ RNAi mutants. Bars on the graphs represent averaged 2^ddCt, and the y-axis is log2. Further explanation can be found in the materials and methods. Error bars: S.E.M. calculated in GraphPad PRISM. p-values were calculated using GraphPad PRISM using an unpaired t-test, two-tailed, and compared each mutant to the y w control. * p < 0.05; ** p < 0.01; *** p < 0.001; ns: not significant.

