Figure 1.
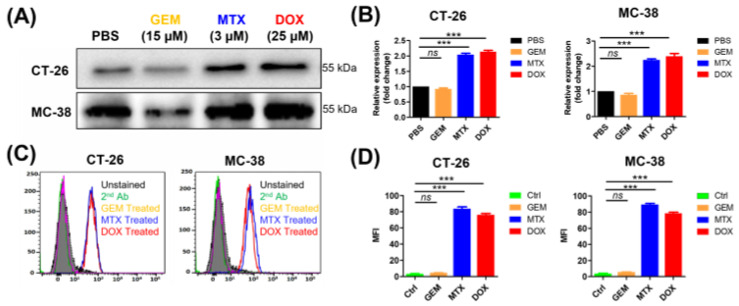
Measurement of ecto-CRT during immunogenic cell death (ICD) in cancer cells after anticancer drug treatment. Cancer cells lines, including CT-26 and MC-38, were treated with anticancer drugs at the indicated concentrations for 4 h and ecto-CRT (CRT translocated from the ER to the plasma membrane) was measured during the pre-apoptotic stage. (A) Western blot analysis. The membrane fractions were isolated and separated by SDS-PAGE. Ecto-CRT was detected with an anti-CRT antibody. (B) Quantitation of Western blot analysis. The ecto-CRT detected in (A) was quantitated and the relative levels are shown. (C) Flow cytometry analysis of ecto-CRT. Cells were treated with anticancer drugs and stained with an anti-CRT antibody. (D) The mean fluorescence intensities (MFIs) of the samples shown in (C) were measured and the relative levels were plotted. Second Ab is used as control of the background fluorescence signals. Data represent the mean ± standard error (n = 3). *** p < 0.001 and ns = non-significant. (MTX, mitoxantrone; DOX, doxorubicin; GEM, gemcitabine).

