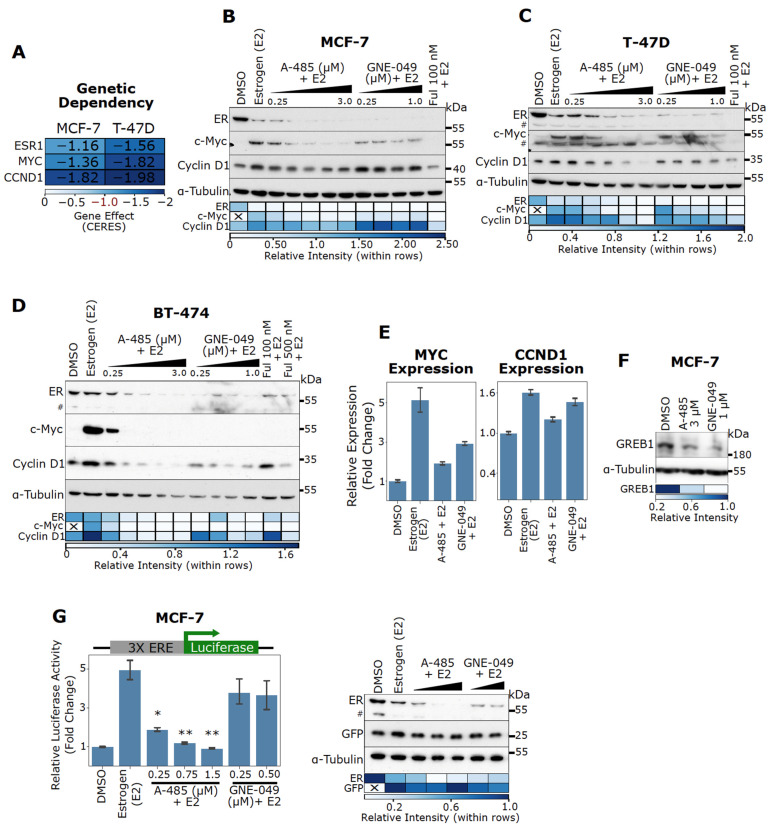
Figure 2.
CBP/p300 KAT inhibitor A-485 and BD inhibitor GNE-049 downregulate ER protein levels and antagonize E2-stimulated activation of ER target genes MYC and CCND1. (A) ESR1, MYC, and CCND1 are essential in ER+ BC cells as determined by the Cancer Dependency Map. A Gene Effect of 0 is the median nonessential KO effect and -1 is the median essential KO effect. (B–D) CBP/p300 inhibitors potently reduce ER protein levels and antagonize E2-induced c-Myc expression in MCF-7 (B), T-47D (C), and BT-474 (D) cells. Cells were cultured in complete CSS medium, and then exposed to A-485 and GNE-049 for 24 h and E2 (1 nM) was added 6 h before cell lysis. ER, c-Myc and Cyclin D1 protein levels were assessed via immunoblotting. Densitometry quantification of the immunoblot bands are depicted below via heatmap. (E) Representative qPCR results for MYC and CCND1 expression in MCF-7 cells treated with E2 (1 nM), A-485 (750 nM), GNE-049 (250 nM) or their combination. Cells were cultured in complete CSS media and treated with CBP/p300 inhibitors for 24 h. E2 was added 4 h before lysis. Representative results of n = 2. Errors bars are SEM of two technical replicates. (F) A-485 and GNE-049 reduce GREB1 expression. MCF-7 cells were treated with A-485 and GNE-049 for 24 h in complete media and GREB1 protein levels were detected by immunoblotting. Densitometry quantification of the immunoblot bands are depicted below via heatmap. (G) A-485 potently blocks E2-activation of an ERE luciferase reporter. MCF-7 cells were transfected with a 3X ERE luciferase reporter plasmid and GFP. Cells in complete CSS media were exposed to varying doses of A-485 and GNE-049 for 24 h. E2 (1 nM) was added 6 h before cell lysis and luciferase activity was measured. A representative immunoblot is shown to the right for ER and GFP expression (representative of n = 3). Densitometry quantification of the immunoblot bands are depicted below via heatmap. Hashtags (#) denote non-specific band in immunoblots in panels C, D and G. In the bar graph in panel G, *: p < 0.05; **: p < 0.005 (Student’s t-test, n = 3).

