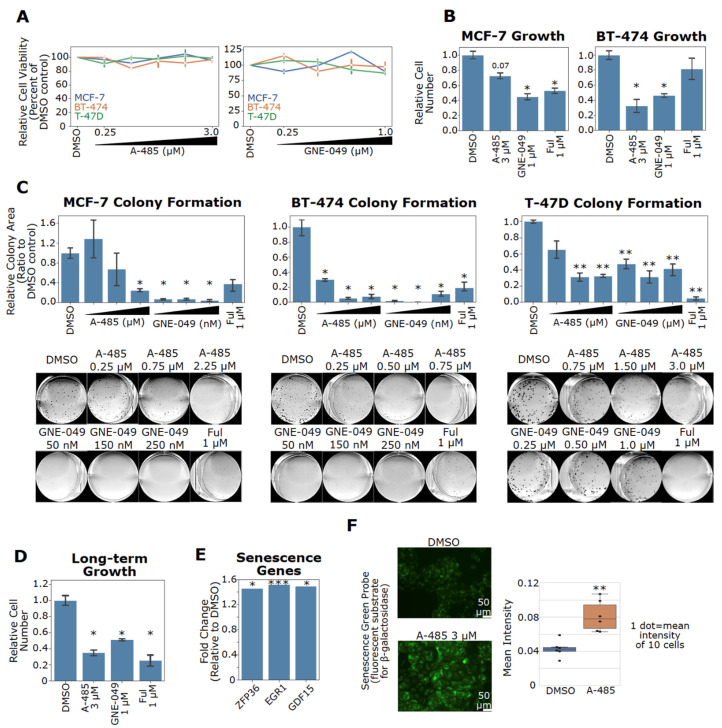
Figure 7.
CBP/p300 inhibitors A-485 and GNE-049 suppress cell growth and induce senescence of ER+ BC cells. (A) CBP/p300 inhibitors do not acutely reduce cell viability in ER+ BC cells. MCF-7, T-47D, and BT-474 cells were treated with A-485 and GNE-049 at the indicated concentrations for 96 h. Cell viability was measured with Cell-TiterGlo. (B) CBP/p300 inhibitors block cell proliferation in ER+ BC cell lines. MCF-7 and BT-474 cells were treated with the indicated concentrations of A-485 and GNE-049 for 8 days. Cell numbers were then counted and the relative cell numbers are shown (normalized to the DMSO control, n = 3). (C) CBP/p300 inhibitors potently suppress colony formation in ER+ BC cell lines. MCF-7, BT-474 and T-47D cells were treated with the indicated concentrations of A-485 and GNE-049. Colonies were allowed to grow for between 2–3 weeks. Colony area was measured by ImageJ plugin ColonyArea and normalized to the DMSO control (n = 3). Representative colony images for each cell line are shown below. (D) Long-term CBP/p300 inhibition retards cell growth after drug washout. MCF-7 cells were treated as in (B) for 8 days. Cells were then counted, re-seeded and allowed to grow for 9 days in the absence of drugs. The relative growth of drug treated cells vs DMSO control from three independent experiments (n = 3) is plotted. (E) A-485 upregulates senescence-associated genes in MCF-7 cells. Data are from the microarray experiment. Fold changes of these genes are plotted. (F) A-485 induces senescence in MCF-7 cells. MCF-7 cells were treated with A-485 for 8 days. Cells were then counted and re-seeded in 96 well plates. At 24 h after reseeding, cells were stained for β-galactosidase activity and mean intensity of staining was quantified. Representative images of two independent experiments (n = 2) are shown. In the bar graph in panel G, *: p < 0.05; **: p < 0.005; ***: p < 0.0005 (Student’s t-test).

