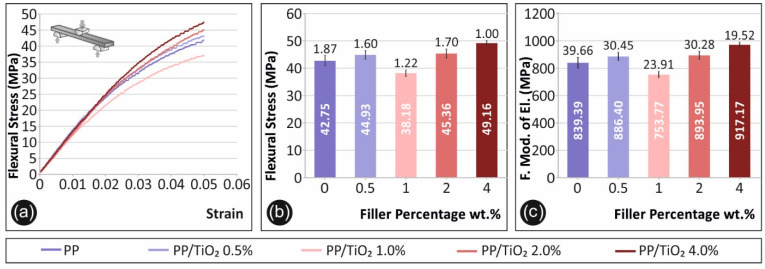
Figure 4.
Flexural test results: (a) representative specimen’s flexural stress (MPa) to strain graphs, (b) average maximum flexural stress values calculated (MPa) and the respective deviations in comparison with the filler’s concentration for each fabricated material, and the (c) average flexural modulus of elasticity (MPa) and the respective deviations in comparison with the filler’s concentration for each fabricated material.

