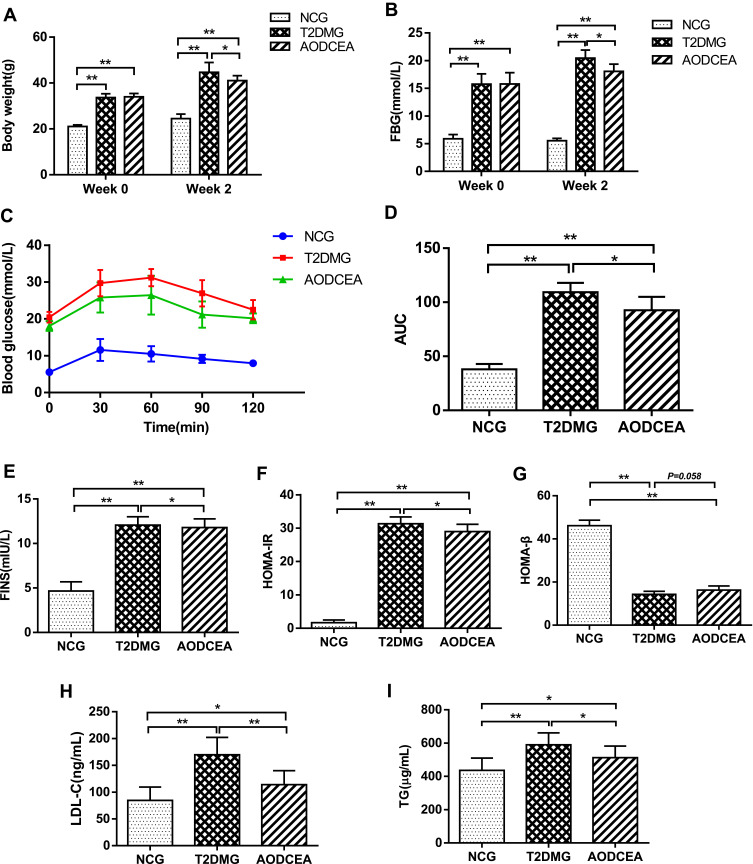
Figure 1.
Effects of AODCEA on general indicators of diabetes. (A) Body weight and (B) FBG changes before and after AODCEA intervention. (C) Blood glucose values at each time point of OGTT; (D) AUC was calculated according to the OGTT curve. (E) Serum insulin levels was determined after treatment; (F) HOMA-IR index was calculated from the following formula: HOMA-IR = FINS × FBG/22.5; (G) HOMA-β index was calculated from the formula: 20 × FINS/(FBG-3.5). Triglycerides (TG) (H) and low density lipoprotein cholesterol (LDL-C) (I) levels in mice serum were analyzed using ELISA kit. Data are expressed as means ± SD. Differences were assessed by ANOVA followed by LSD post hoc test and denoted as follows: *p < 0.05, **p < 0.01 (n = 8).

