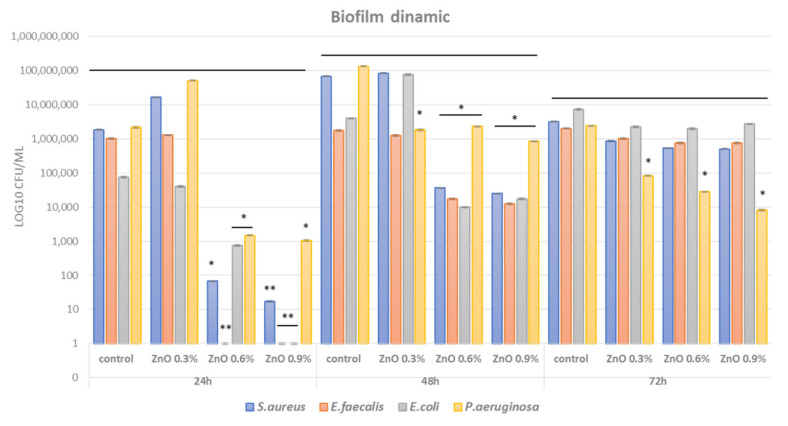
Figure 8.
Graphic representation of average log10 CFU/mL values obtained for the tested Gram-positive and Gram-negative microbial strains, expressing biofilm embedded cells developed on control and ZnO NPs-coated dressings for different time points (24 h, 48 h, 72 h) (* p < 0.05; ** p < 0.001 by comparing biofilm formation on control and each ZnO-coated dressings).

