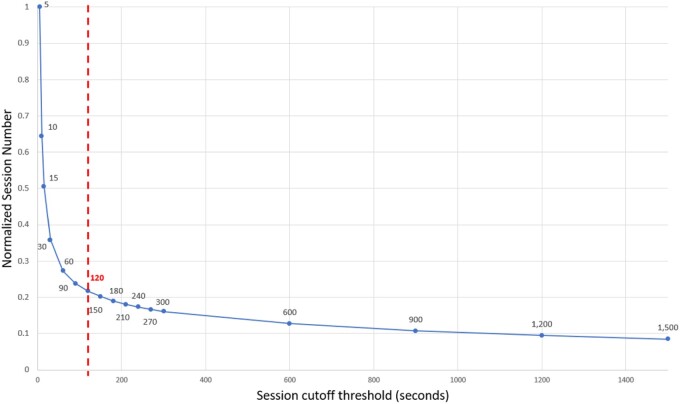
Figure 2.
The data-driven detection of a stable sessionization threshold, by finding the point of maximum curvature in the normalized session number curve. This curve was derived through testing 17 thresholds, which yielded a diminishing number of sessions, each represented by a labeled point ranging from 5 to 1500 seconds. Here, the selected sessionization time threshold is highlighted in red, being 120 seconds, and was the point of maximum curvature estimated through the Kneedle algorithm.

