
Figure 2. Establishment of multi-lineage immune engraftment.
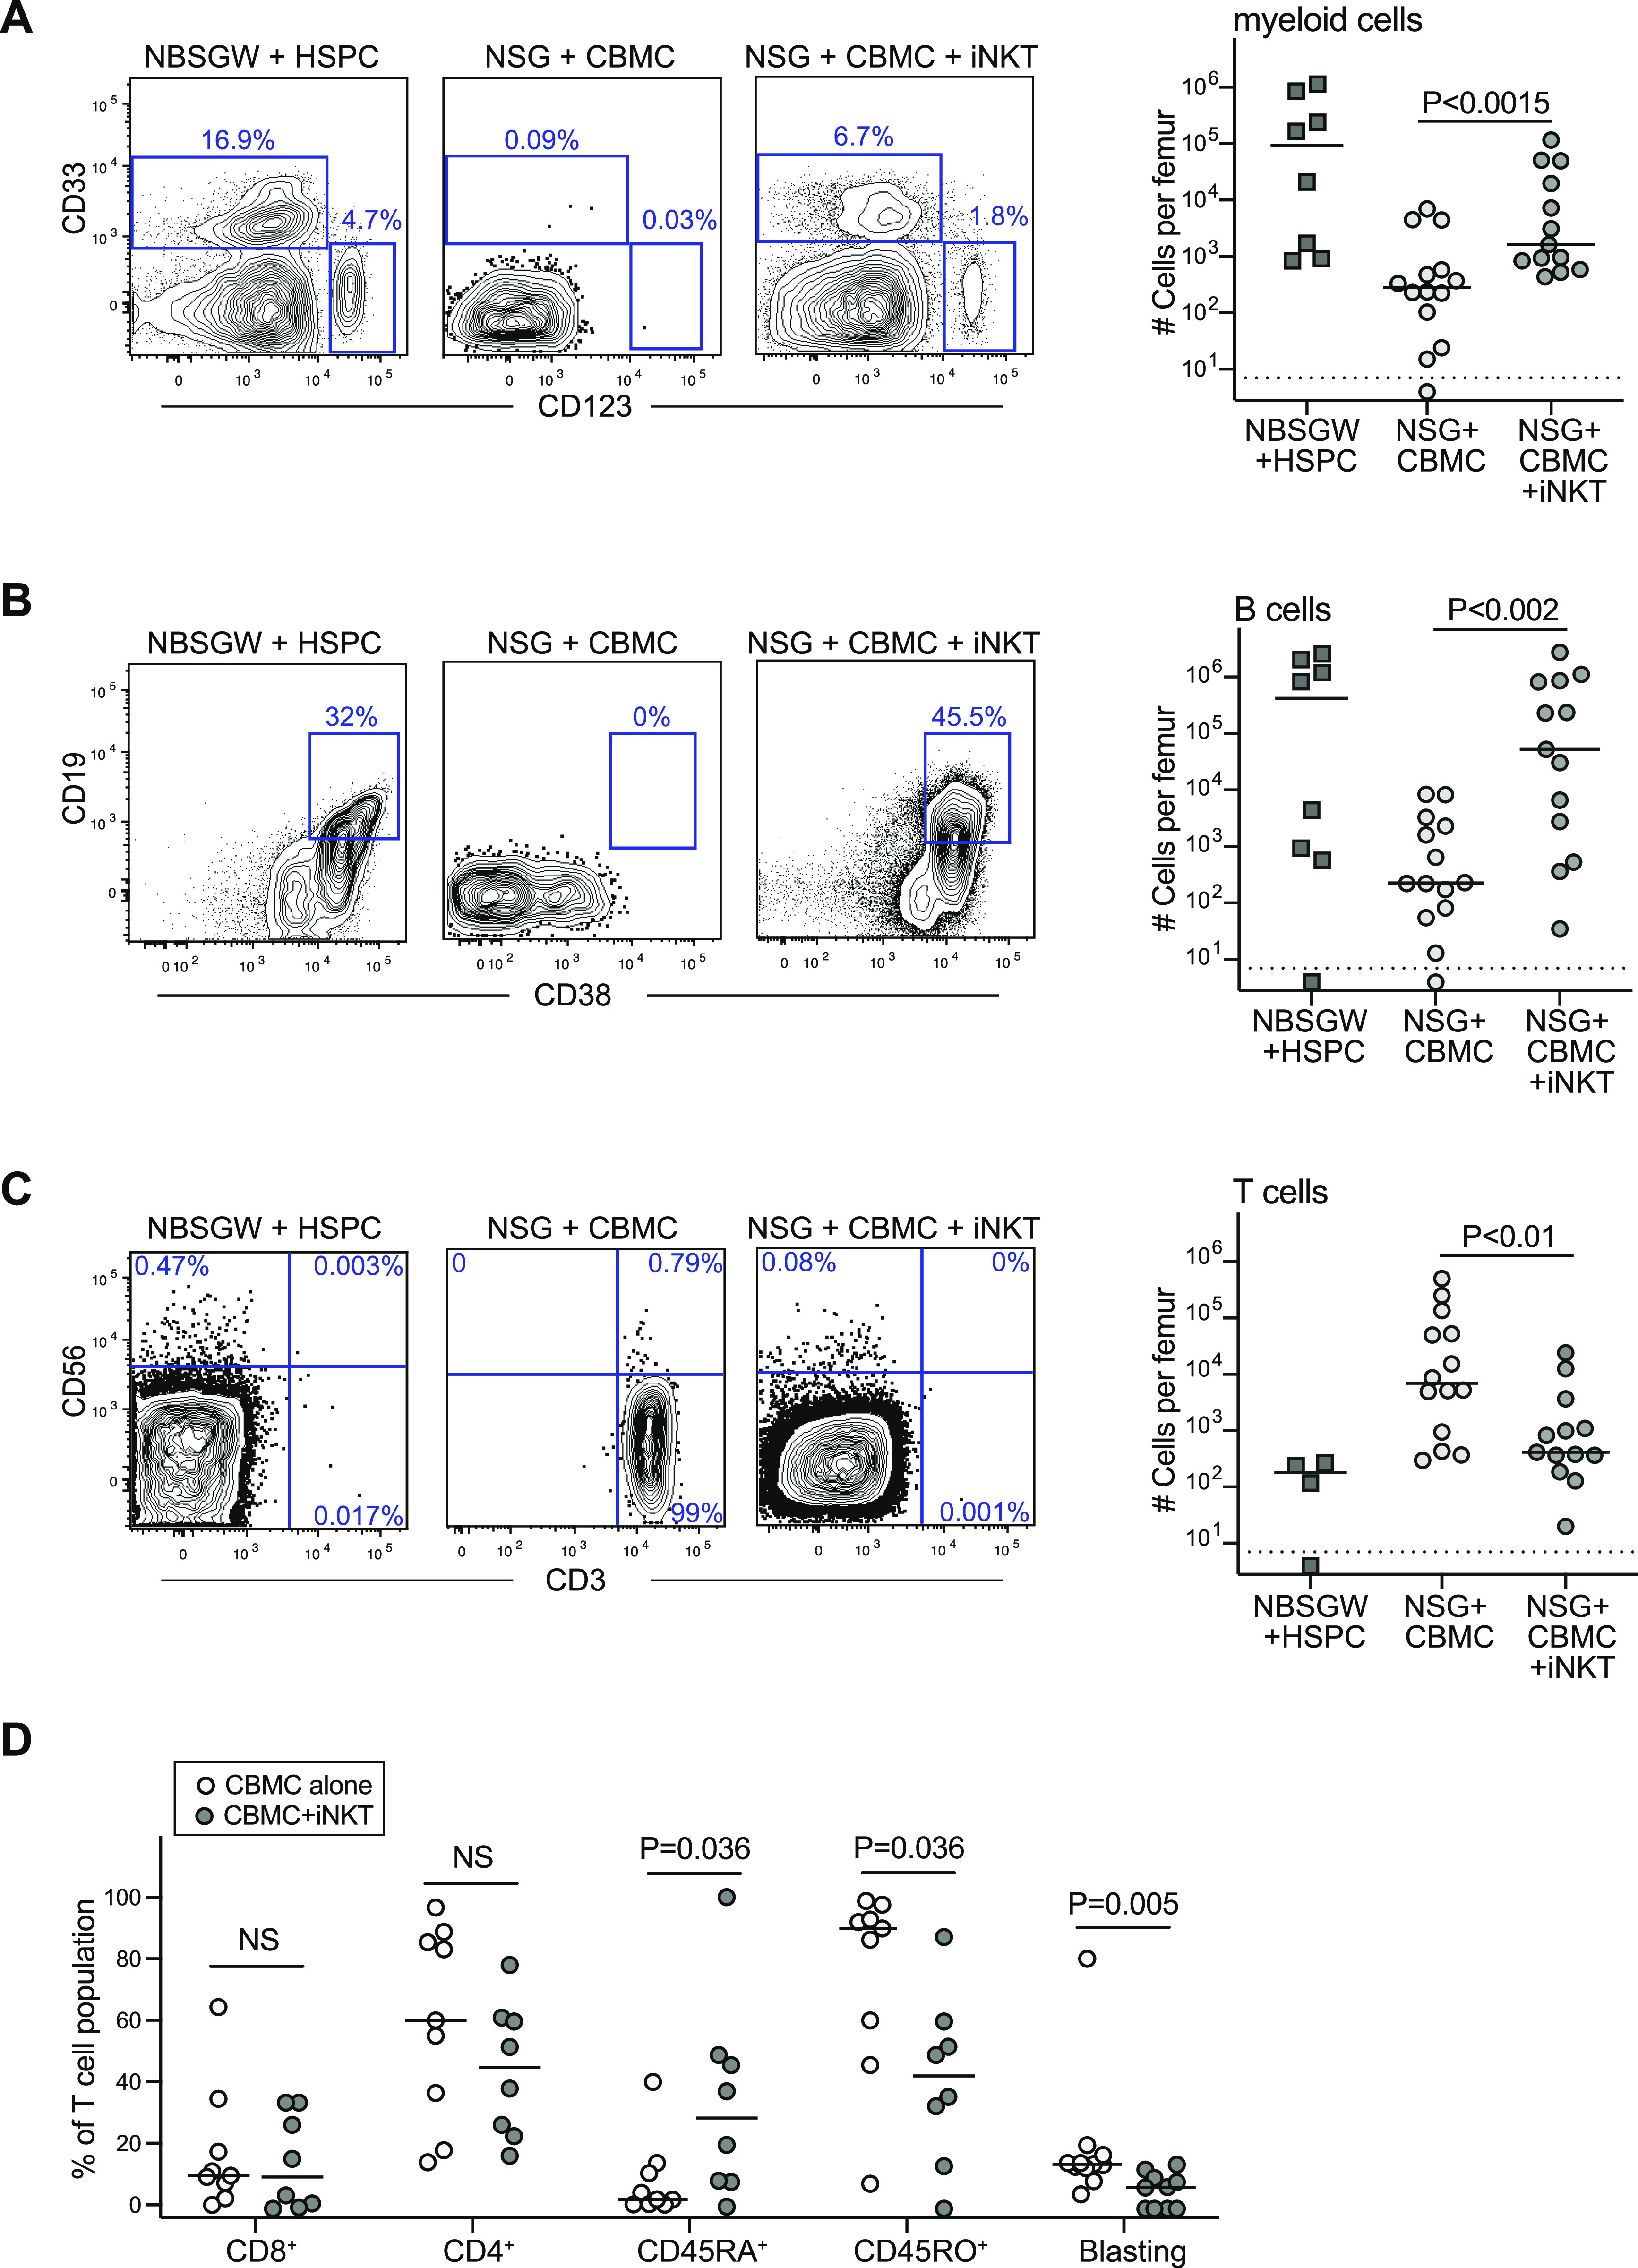
(A) Flow cytometric analysis of murine bone marrow samples collected at 3 mo posttransplantation showing staining of the CD34-negative human population for myeloid lineage markers (CD33 and CD123). Plot on right shows numbers of human myeloid cells detected in one femur bone of mice in the indicated treatment groups, with bars showing the median for each group (symbol below dotted line indicates no specifically detectable cells). Results aggregated from nine independent experiments; P-values calculated using a two-tailed Mann–Whitney test. (B) Staining for B-lineage cells, and aggregated data for numbers of B cells in bone marrow. (C) Staining for T cells and NK cells, and aggregated data for numbers of T cells in bone marrow. (D) Aggregated data for phenotypic analysis of T cells detected in bone marrow of mice that received cord blood mononuclear cells alone (light symbols) compared with cord blood mononuclear cells + invariant natural killer T cells (dark symbols).