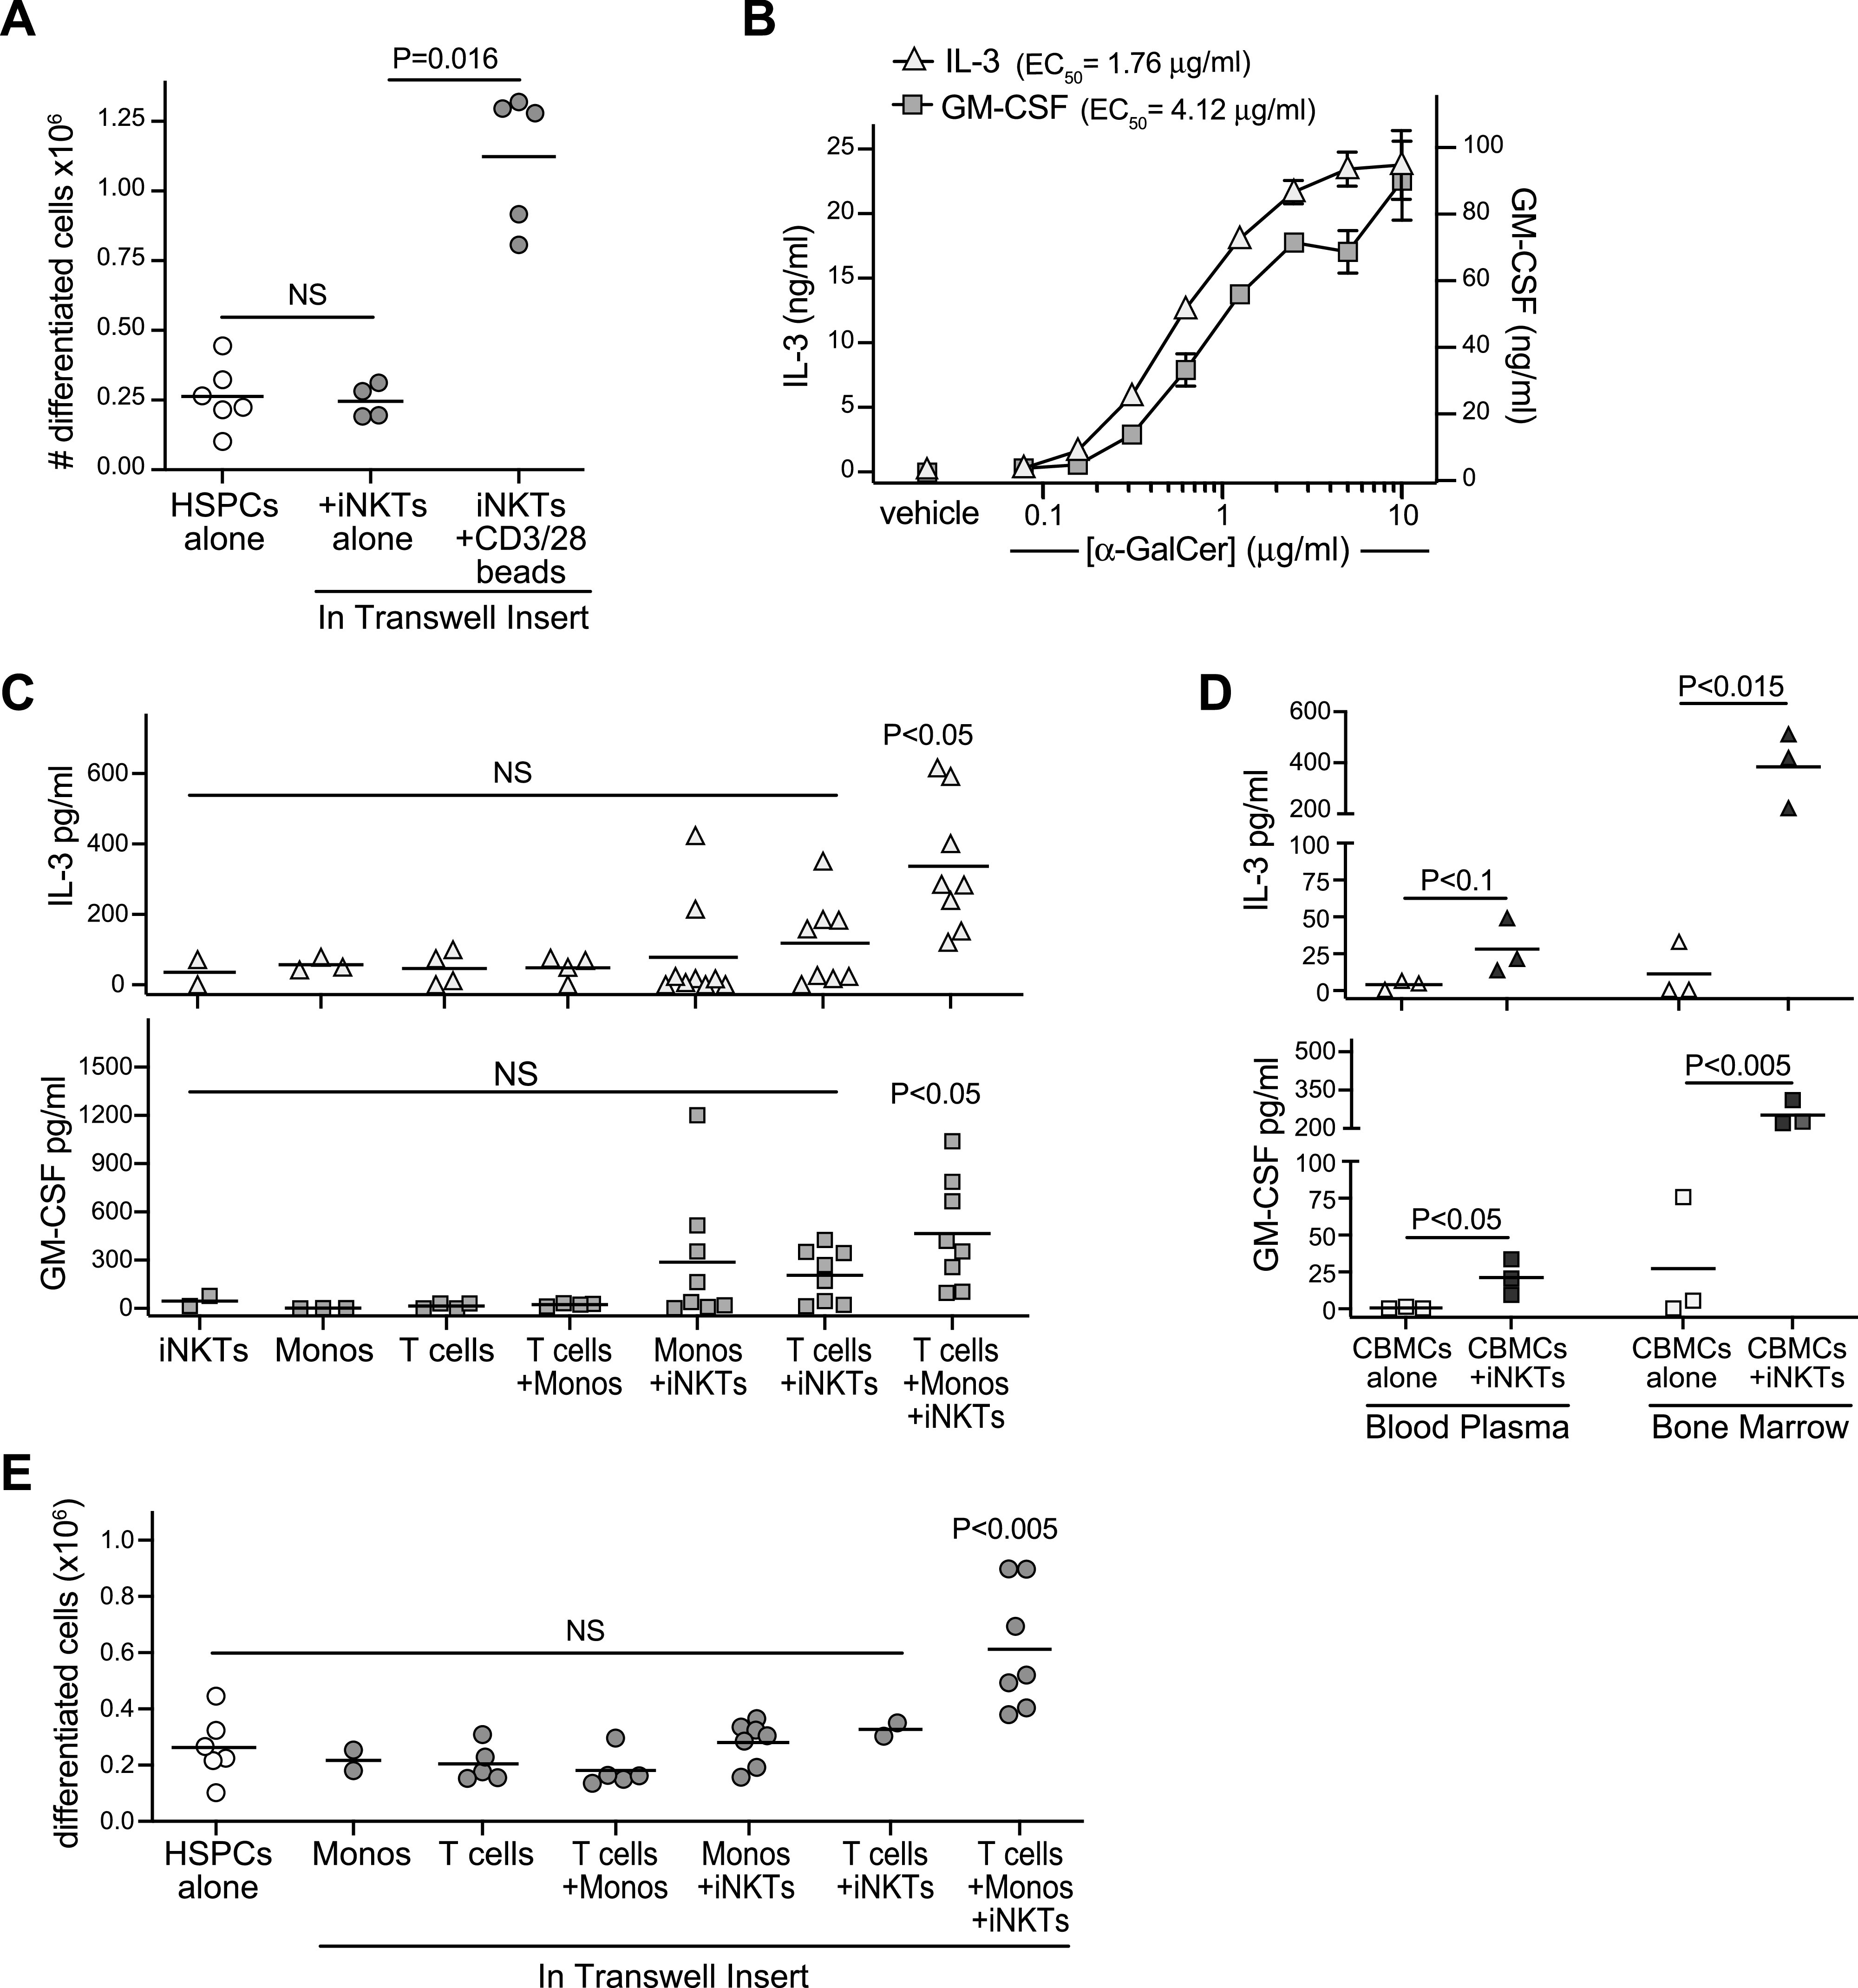
Figure 5. Invariant natural killer T (iNKT) cells show pro-hematopoietic activity that is activated by exposure to cord T cells and monocytes.

(A) Purified CD34+ HSPCs were seeded at 2.5 × 10⁴ cells/well and cultured in the lower wells of transwell plates in medium containing a hematopoietic cytokine cocktail. Where indicated, iNKT cells were added to the transwell inserts alone or in combination with CD3/CD28 Dynabeads. After 10 d, the number of lineage+ cells in the lower transwell was quantitated. Plot shows aggregated results from six independent experiments with bars at the means and P-values calculated by a two-tailed Mann–Whitney test. (B) CD4+ iNKT cells were exposed to plate-bound recombinant CD1d–Fc fusion protein that had been pretreated with the indicated concentrations of α-GalCer lipid antigen or with vehicle alone. Plot shows amounts of IL-3 (left axis) or GM-CSF (right axis) detected in the culture supernatant after 24 h. Symbols show means of three replicate wells, with error bars showing standard deviations (not always large enough to be visible). (C) iNKT cells, isolated cord T cells, and/or autologous cord monocytes were cultured alone or in the indicated combinations for 48 h, and amounts of GM-CSF and IL-3 in the culture supernatants were quantitated. Each symbol represents the mean amount of cytokine detected from two to three replicate wells of an independent analysis, with bars showing means of aggregated results. P-values were calculated using a two-tailed Mann–Whitney test for each condition in comparison to iNKT cells alone. (D) Analysis of human GM-CSF and IL-3 levels in bone marrow or blood plasma of NSG mice transplanted with cord blood mononuclear cells alone or cord blood mononuclear cells + iNKTs. Each symbol represents the mean amount of cytokine detected from an individual mouse; P-values calculated using a two-tailed unpaired t test. (E) Purified CD34+ HSPCs were seeded at 2.5 × 10⁴ cells/well and cultured in the lower wells of transwell plates in medium containing a hematopoietic cytokine cocktail. Where indicated, iNKT cells, cord monocytes, and/or autologous cord T cells were added to the transwell inserts. After 10 d, the number of lineage+ cells in the lower transwell was quantitated. Plot shows aggregated results from five independent experiments with bars at the means. P-values were calculated using a two-tailed Mann–Whitney test for each transwell culture condition in comparison to HSPCs cultured alone.
