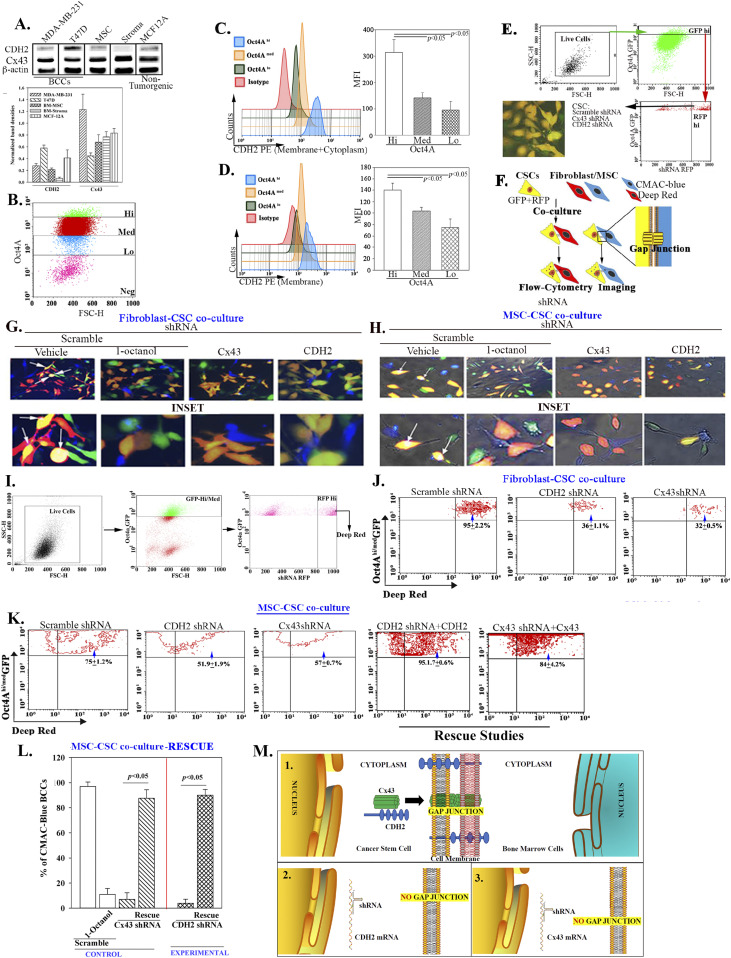
Figure 1. CDH2 in gap junctional intercellular communication (GJIC).
(A) Top panel: Western blot for CDH2 and Cx43 with whole-cell extracts from BCCs, stromal fibroblast, and MCF12A. The normalized band densities are shown below. (B) Shown is the gating scheme to select different BCC subsets with MDA-MB-231 cells with stable pEGFP1-Oct4A. (C, D) Representative histogram for flow cytometry for total (intracellular + membrane) (C) and membrane (D) CDH2 (left). The mean fluorescence intensities are presented ±SD for five independent analyses (right). (E) The gating scheme used to sort cancer stem cells (CSCs) (GFP), knockdown for CDH2 (RFP) or Cx43 (RFP). Lower left shows a representative image of the sorted cells (GFP + RFP = Yellow). (F) Diagram for the assay used to detect dye transfer from stromal fibroblast to CSCs. (G, H) MDA-MB-231-pOct4A-GFP were transfected with scramble-RFP (control), CDH2-shRNA-RFP, or Cx43-shRNA-RFP and then co-cultured) in four-well chamber slides at 1:1 ratio with BM stromal fibroblasts or mesenchymal stem cells (MSCs), respectively. The two latter cells were labeled with CMAC (blue). After 72 h, the cells were imaged for dye transfer using EVOS FL2 Auto 2 (200×). Parallel co-cultures with scramble shRNA contained 300 µM 1-octanol. Dye transfer is shown in the white areas (arrows). Larger images of the top images are shown below. (G, H, I) Gating scheme: the imaging studies for dye transfer in “(G, H)” were repeated by flow cytometry as follows: BM fibroblasts and MSCs were labeled with deep red dye. The live cells were gated based on FSC and SSC. After this, we selected RFPhi (shRNA) BCCs within the Oct4a-GFPhi/med subset then analyze for deep red dye transfer into the selected BCCs. (J) Flow cytometry representing the % dye transfer in fibroblast (included in the respective quadrant). (K) Flow cytometry representing the % dye transfer in MSCs (included in the respective quadrant). The last two panels show that CDH2 and Cx43 were rescued in the respective knockdown CSCs and then used for dye transfer from MSC into Oct4aGFPhi/med BCCs by flow cytometry. The % dye transfer is shown within the respective quadrant. (K, L) The rescue studies in (K) were repeated by imaging except for labeling MSCs with CMAC-blue dye. The cells showing dye transfer were imaged with the EVOS FL Auto 2, 200× magnification. The data were quantified with imageJ and then presented as mean % CMAC ± SD/10 fields/experiment (n = 3). M) (1) CDH2–Cx43 complex in the cytosol shown moving to the cell membrane where GJIC is established with BM niche cells. (2) CDH2 knockdown prevents Cx43 membrane localization, blunting CSC to form GJIC with BM niche cells. (3) Cx43 knockdown decreases GJIC on the membrane.
Source data are available for this figure.

