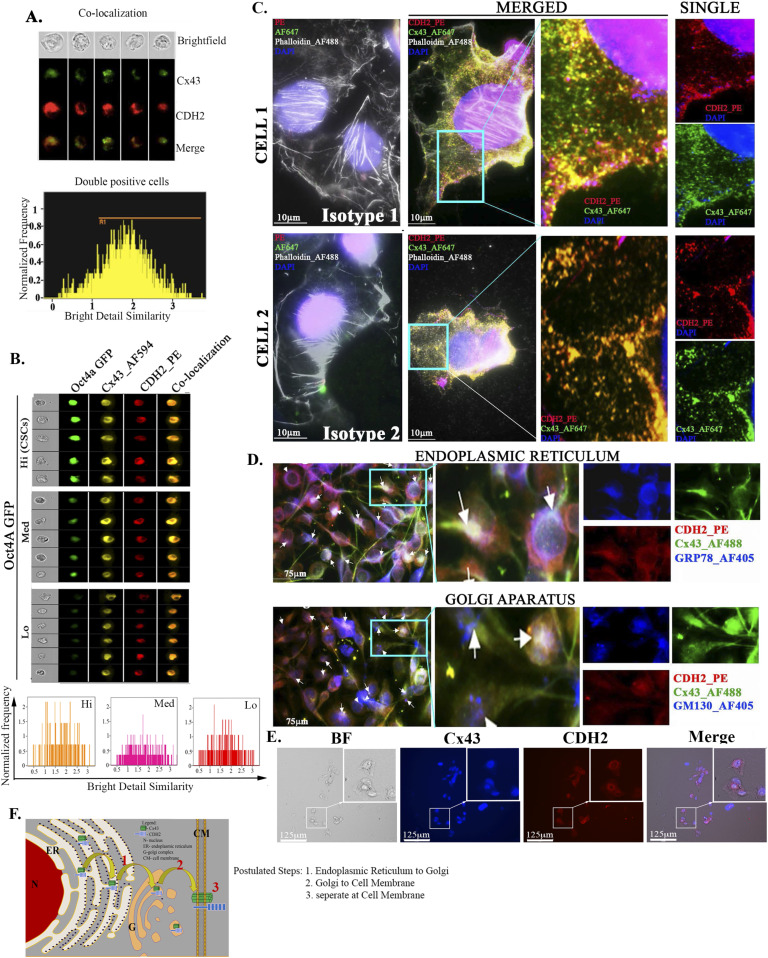
Figure 2. Colocalization of CDH2 and Cx43 in unsorted BC cells.
(A) ImageStream analyses of single cells for colocalized CDH2 (PE) and Cx43 (AF610) in MDA-MB-231. Upper panel: top row, bright-field cells; lower rows, fluorescence imaging of single cells; Lower panel: histogram of fluorescence distribution for the merged images. (A, B) Upper panel: ImageStream analyses was repeated as for “(A),” except with different BC cell subsets (Oct4hi, Octmed, and Oct4lo) from MDA-MB-231-Oct4a-GFP cells; lower panel: histogram of fluorescence distribution for the merged images. (C) Nanoscale imaging of MDA-MB-231, labeled with anti–CDH2-PE (red) and anti–Cx43-AF647 (green), actin with AF488 Phalloidin (white/grey) and nuclei with DAPI (Blue). Slides were imaged with the Nanoimager S Mark II, 1,000× magnification. Cells 1 and 2 represent images of colocalized CDH2 and Cx43 (yellow). Enlarged sections, second from right column, with the respective channels at the far-right column. Isotype control is shown at the far-left column. (D) MDA-MB-231 cells were colabeled with anti–CDH2-PE, anti–Cx43-AF488, and anti–GRP78-AF405 (ER) or anti–GM130 AF405 (Golgi G). The cells were imaged with EVOS FL2 Auto at 200× magnification. (E) MDA-MB-231 cells were treated with 5 μg/ml brefeldin-A. After 24 h, the cells were washed and then colabeled with anti–CDH2-PE and anti–Cx43-AF405 followed by imaging with EVOS FL2 Auto at 200× magnification. (F) Cartoon summaries the organelle labeling for colocalized CDH2 and Cx43 from ER to G and then to cell membrane.

