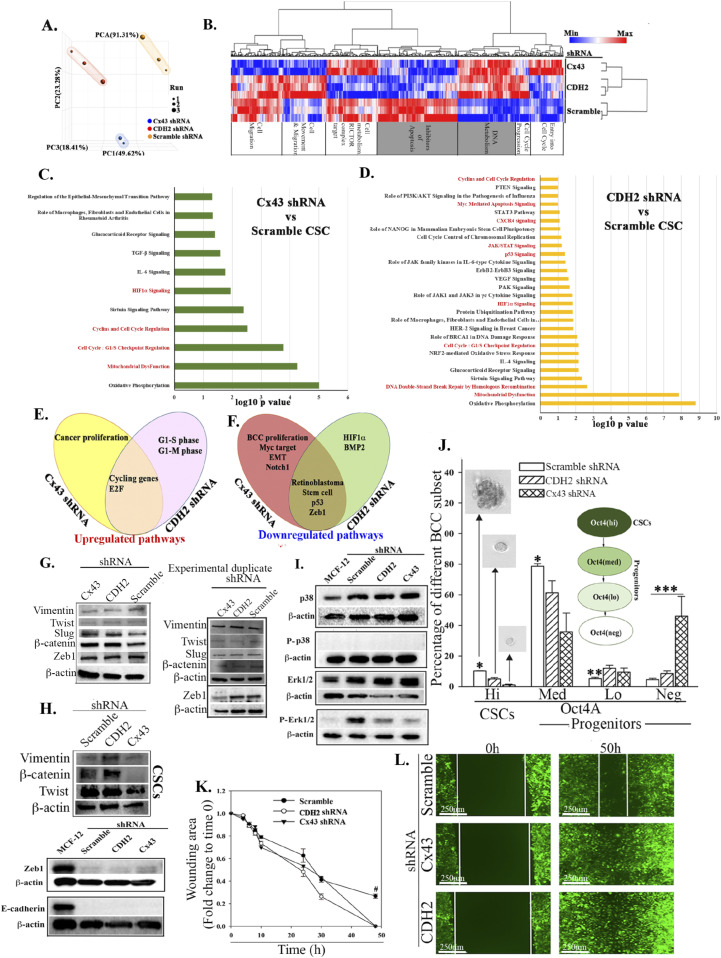
Figure 5. Next generation sequencing of cancer stem cells (CSCs), knockdown for CDH2 and Cx43.
(A) Principle component analyses of RNA-Seq data from the CSCs of the knockdown and control (scrambled) cells. (B) Heat map with genes using false discovery rate <0.05 and fold change for CDH2 versus scramble of 1.66 and Cx43 versus scramble 1.5. (C, D) IPA analyses showing significant changes, Cx43 or CDH2 knockdown versus scramble shRNA. The pathways were ranked using significance score (P < 0.01), also known as −log10 P-value times activation z-score. Red highlights: relevance to cell cycle and stem cell maintenance. (E, F) Venn diagram showing up- and down-regulated pathways of Cx43 or CDH2 knockdown versus scramble using significance scores of q < 0.05. (G, H) Western blot for epithelial mesenchymal transition proteins with whole cell extracts from the following: unsorted MDA-MB-231 (G); CDH2 or Cx43 knockdown CSCs, CSCs with scrambled shRNA (H). (I) Western blot for p38, P-p38, Erk1/2, and p-Erk1/2 with whole cell extracts from MCF12A and MDA-MB-231 CSCs with or without CDH2/Cx43 knockdown. (J) BC cell subsets were quantitated by flow cytometry, based on GFP with MDA-MB-231–p-Oct4a-GFP, also knockdown for CDH2 or Cx43 or control/scramble shRNA. The cells were gated as for Fig 1B and % subset plotted as mean ± SD, n = 4. Each subset was analyzed for tumorsphere and representative sphere shown for Oct4hi and Oct4med. No tumorsphere was formed with Oct4lo or neg. *P < 0.05 versus Oct4hi or Oct4med knockdowns; **P < 0.05 versus knockdowns; ***P < 0.05 versus scramble or knockdown. (K, L) Scratch assay with CSCs from MDA-MB-231, knockdown for CDH2 or Cx43 or control/scramble shRNA. The scratch areas were imaged at different times with EVOS FL Auto 2. The timeline changes are presented as mean fold changes ± SD, n = 3. Fold change is calculated as experimental/time 0 h. #P < 0.05 versus CDH2 and Cx43 knockdown. Scratch image (100×) is shown for the 50 h end point.
Source data are available for this figure.

