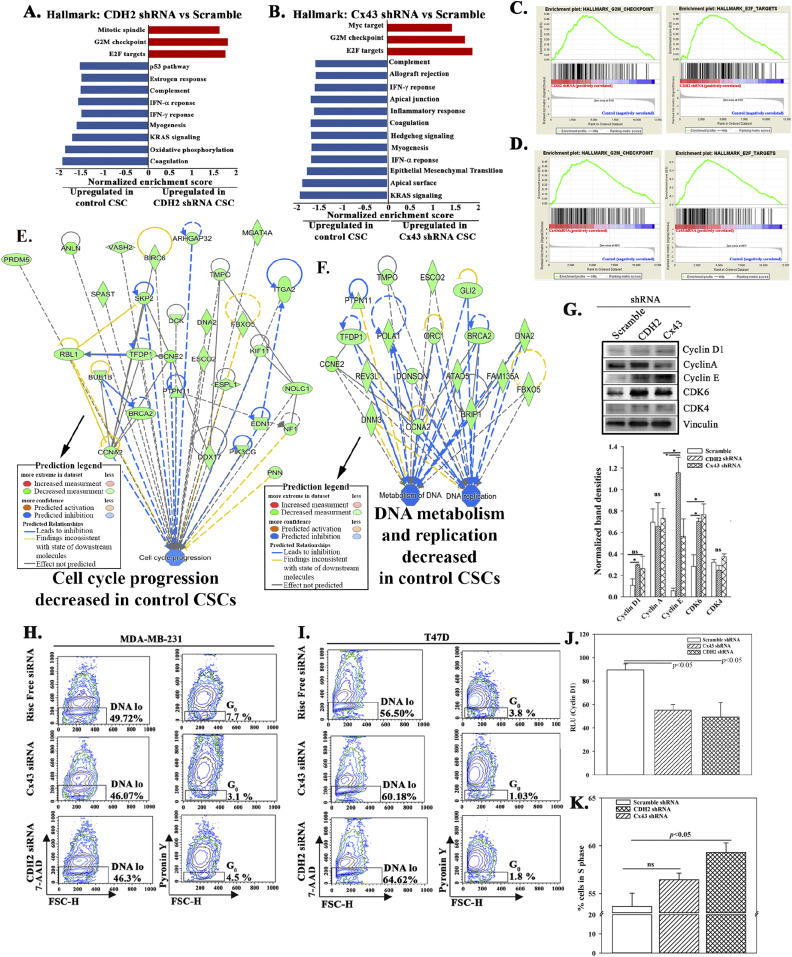
Figure 6. Cycling analyses of cancer stem cells (CSCs), knockdown for CDH2 or Cx43.
(A, B) Gene set enrichment analyses hallmarks for CDH2 or Cx43 knockdown versus scramble CSCs. The red and blue bars indicate up-regulated hallmarks in CDH2 knockdowns and control/scramble, respectively, with significance score of q < 0.05. (C, D) Representative gene set enrichment analyses graph showing top hallmarks, G2M and E2F, which were enriched in CDH2 and Cx43 knockdown, respectively. (E, F) IPA output showing cell cycle progression, DNA metabolism, and replication pathways that were down-regulated in CSCs (scramble), relative to CDH2 or Cx43 knockdown cells. Significance score used P < 0.01. (G) Western blot for cycle proteins with whole extracts from MDA-MB-231, knockdown for CDH2, and Cx43 or transfected with scramble shRNA. (H, I) The normalized band densities are shown below, mean ± SD, n = 3. *P < 0.05 (H, I) MDA-MB-231 (H) and T47D (I) were knockdown CDH2 and Cx43 with siRNA. Control cells used Risc free. The cells were labeled with PyY (RNA) and 7AAD (DNA). Cells with low RNA was gated within the low DNA area. The data were analyzed with BD Analyses software. (J) CDH2 or Cx43 knockdown MDA-MB-231-Oct4-GFP were transfected with cyclin D1 reporter gene vector. The reporter gene activity (luciferase) was normalized with pβ–gal activity and the values presented as mean relative luminescence unit ± SD, n = 4. (K) CDH2 or Cx43 knockdown MDA-MB-231 were labeled with 7AAD. The cells were analyzed for % cells in S-phase for each BC cell subset using ModFit software. The data are presented as mean S phase±SD, n = 3.
Source data are available for this figure.

