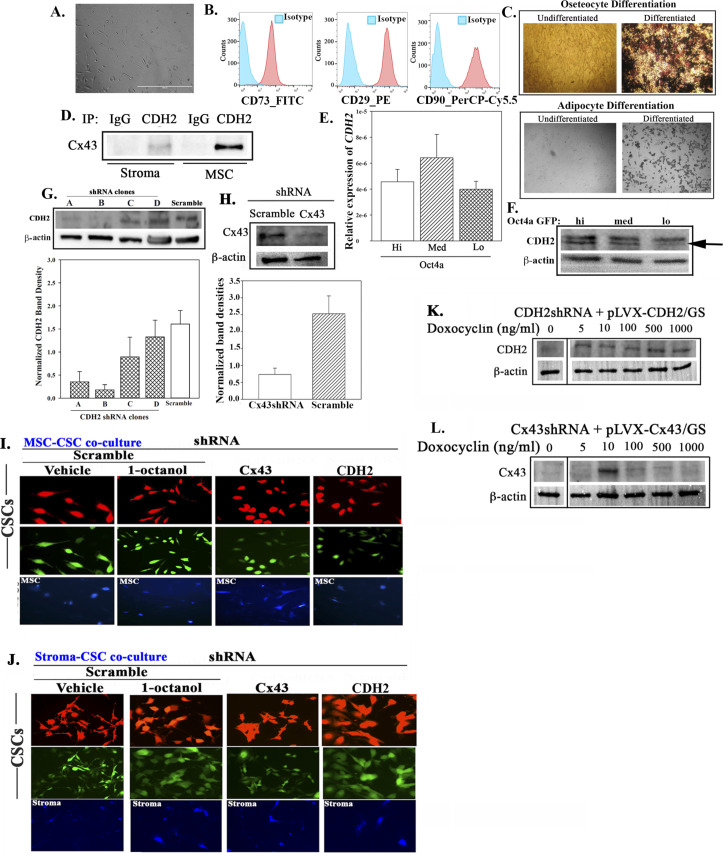
Figure S1. Supporting data for Fig 1.
(A) Representative image of Passage 3 mesenchymal stem cells (MSCs), 400× magnification. (B) Flow cytometry represents BM-MSC characterization. Cells were labeled with anti–CD73-FITC, anti–CD29-PE, and anti–CD90-PerCP-Cy5.5. (C) Induced differentiation of BM-MSCs was performed by culturing the cells in maintenance media or differentiation media (osteogenic or adipogenic). After week 3, cells in the osteocytic media were counter stained with Von Kossa to assess calcium deposit. Representative images are shown for osteocytes (top) and adipocyte (bottom). (D) Whole-cell lysates from BM-MSCs or BM stromal cells were immunoprecipitated with anti-CDH2 or IgG (Antibody control) and then electrophorese on 12% SDS–PAGE. The proteins were transferred onto PVDF membrane for blotting with anti-Cx43. (E) Real time PCR for CDH2. The results were normalized for β-actin and then presented as the mean ± SD (n = 5) relative expression. (F) Western blot with extracts from BC cell subsets: Oct4a-GFPhi, med or lo. (G, H) Top panel: Western blot for CDH2 (F) and Cx43 (G) using whole-cell extracts from MDA-MB-231, transfected with shRNA (scramble, CDH2, or Cx43). Bottom panel: normalized band densities. (H, I, J) Dye transfer assay: M-Oct4-GFP/scramble-RFP, M-Oct4-GFP/CDH2-shRNA-RFP, and M-Oct4 GFP/Cx43-shRNA-RFP were co-cultured at 1:1 ratio with CMAC-blue–labeled BM-stroma (H) or BM-MSCs (I) in four well chamber slides. After 72 h, the cells were imaged for dye transfer. Negative control used co-cultures of M-Oct4-GFP/scramble-RFP and CMAC-blue–labeled stroma or MSCs in the presence of 300 µM 1-octanol. The white spots (white arrows) in the vehicle-treated M-Oct4-GFP/scramble-RFP indicate dye transfer. Inset: enlarged image depicts cells with dye transfer. The cells were imaged using EVOS FL2 Auto 2 at 200× magnification. (K, L) CDH2-shRNA and Cx43 shRNA MDA-MB-231 were infected with inducible lentiviral particle pLVX-CDH2/GS and pLVX-Cx43/GS, respectively. After overnight infection, the cells were induced with different concentrations of doxocycline: 0, 5, 10, 100, 500, and 1,000 ng/ml. After 24 h, proteins were isolated and Western blot performed for CDH2 and Cx43. The membranes were stripped and reprobed with anti–β-actin.
Source data are available for this figure.

