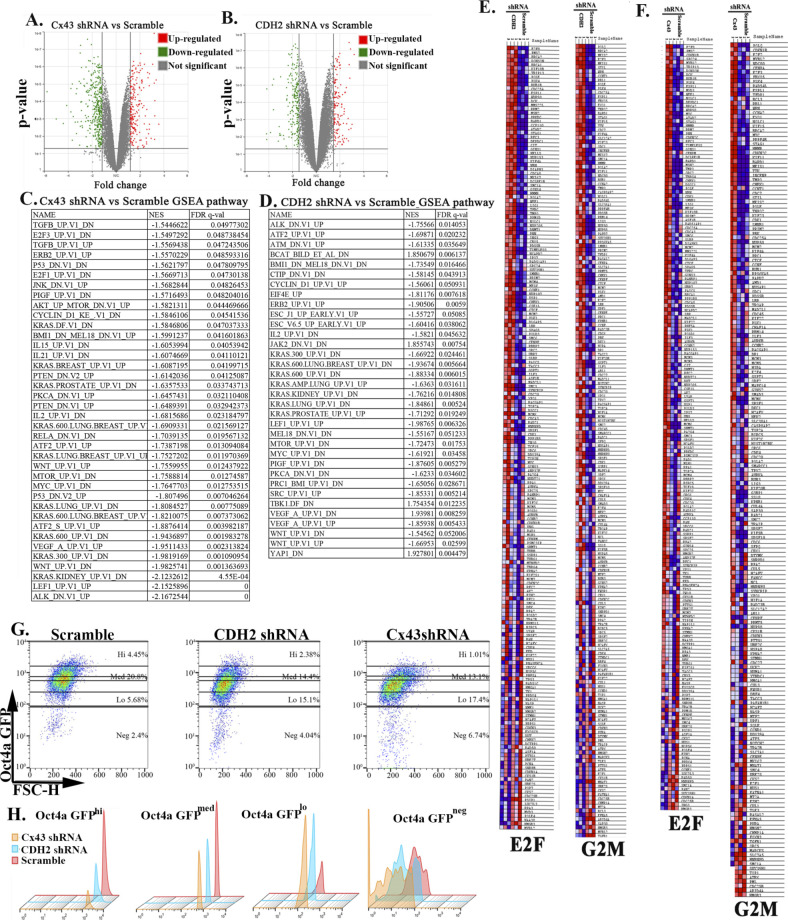
Figure S5. Next generation sequencing of cancer stem cells (CSCs) with or without CDH2 and Cx43 knockdown.
(A, B) Volcano plot for genes expressed (from next generation sequencing) in Cx43 or CDH2-shRNA versus scramble CSCs using Partek software, respectively. We generated the plot using P < 0.05, and fold change, 1.5 and 1.6, respectively. The green indicates genes up-regulated and red indicates genes down-regulated in knockdowns. (C, D) Gene set enrichment analyses pathway analysis of Cx43 or CDH2 knockdown versus scramble with the significance score of q < 0.05, respectively. (E, F) Representative Gene set enrichment analyses heat map for E2F and G2M hallmarks in CDH2 or Cx43 shRNA versus scramble CSCs (expansion of Fig 6C and D). (G, H) Gating scheme for Fig 5J. (G) The figure represents how different subsets were selected from MDA-MB-231 with Cx43, CDH2, and scramble shRNA. The subsets were selected based on GFP expression in Scramble using BD FACSCalibur. Top and bottom: 5% of the GFP cells are Oct4ahi, the center is Oct4amed, followed by Oct4alo and Oct4aneg. (H) Histogram for Fig S5G.

