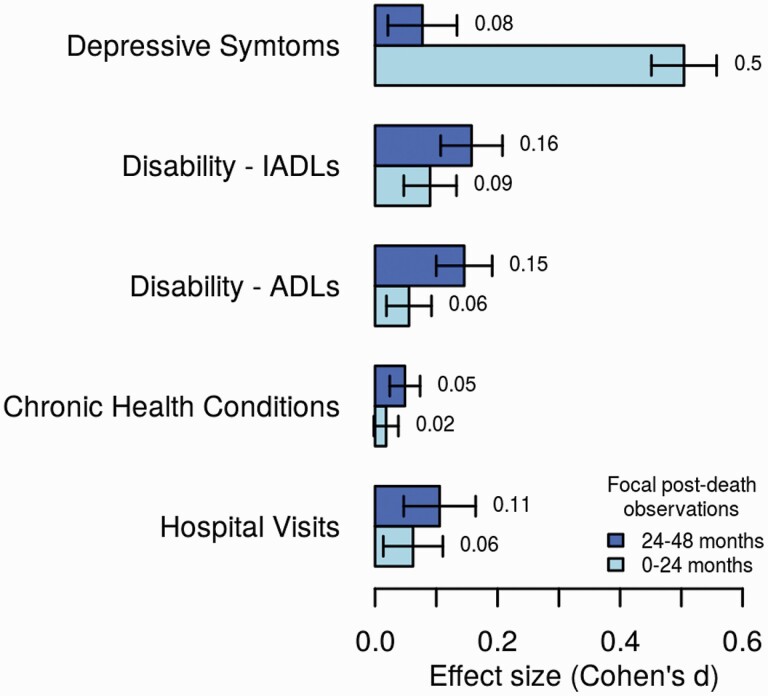
Figure 2.
Bereavement-related depressive symptoms decline with time since spousal death, whereas disability and morbidity increase. Figure graphs effect sizes and 95% confidence intervals for within-person comparisons of Center for Epidemiologic Studies Depression scale (CES-D) and physical health measures before and after spousal death. Effect sizes are graphed for comparisons of average levels predeath to the level at the first observation following spousal death (0–24 months after the death, light bars) and at the second observation following spousal death (24–48 months after the death, dark bars). Health outcomes were adjusted for aging-related decline and period effects (outcome measures were residualized for age [five splines], sex, interactions between the age-based splines and sex, and Health and Retirement Study (HRS) observation wave). Effect-sizes are reported in HRS standard deviation units. Results are based on Equation 3, Supplementary Information A3; full model results are shown in Supplementary Table S3 (minimum N = 13,152 observations of N = 3,145 individuals observed at two HRS observations following spousal death). The figure shows that the increase in depressive symptoms relative to prebereavement levels is largest in the first 2 years following spousal death and then declines. In contrast, increases in disability and morbidity grow larger with increasing follow-up time.

