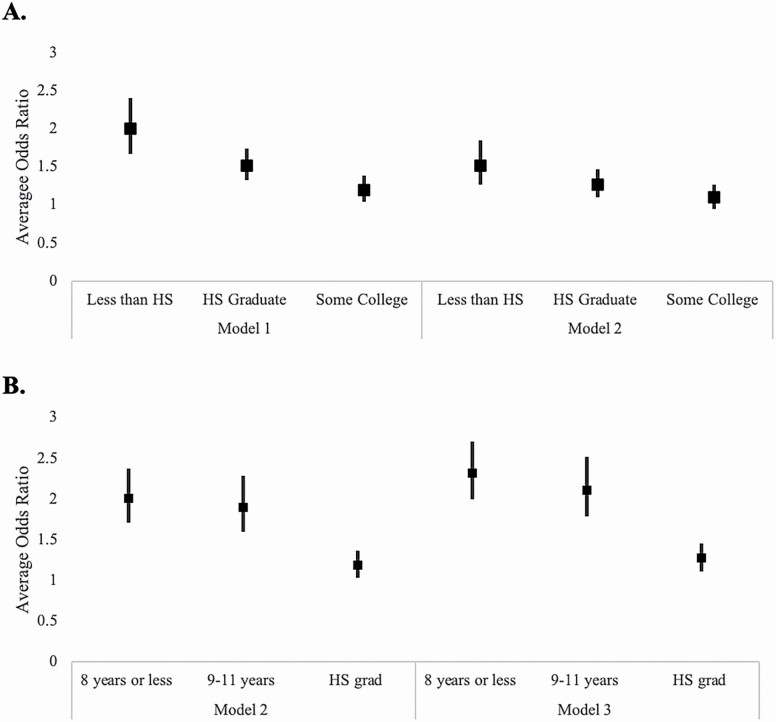
Figure 2.
(A) Estimated relative odds ratio of being in the next sequentially higher cytomegalovirus (CMV) IgG response category by adult socioeconomic status (SES) in the Health and Retirement Study, Venous Blood Sample 2016. Note: Model 1 includes adult SES, race/ethnicity, age, gender, and marital status. Model 2 includes adult SES, race/ethnicity, age, gender, marital status, and parental education. Those with a college education or higher are the reference group. (B) Estimated relative odds ratio of being in the next sequentially higher CMV IgG response category by parental education in the Health and Retirement Study, Venous Blood Sample 2016. Note: Model 2 includes adult SES, race/ethnicity, age, gender, marital status, and parental education. Model 3 includes race/ethnicity, age, gender, marital status, and parental education. Having at least one parent with greater than a high school education is the reference group.

