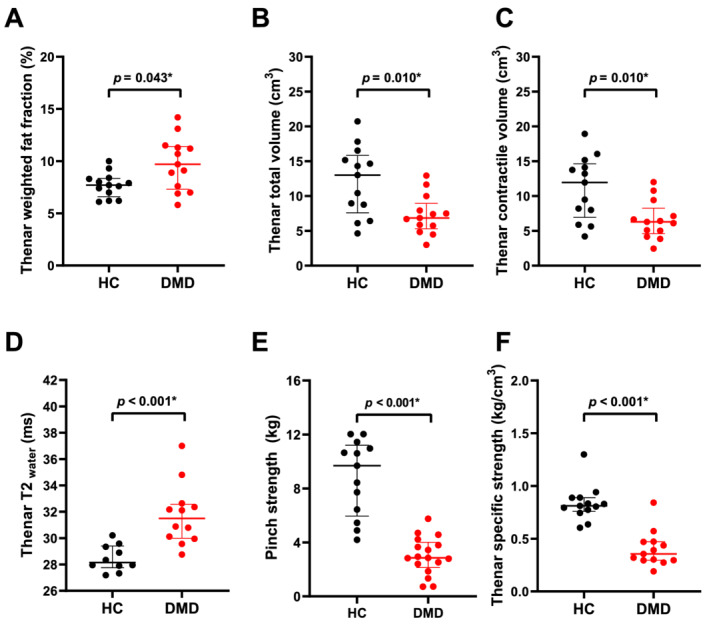
Figure 2.

Dixon and pinch strength results of healthy controls (HC) compared with Duchenne muscular dystrophy (DMD) patients. Thenar weighted fat fraction (FF) (A), total volume (TV) (B), contractile volume (CV) (C), T2water (D), pinch strength (E), and specific strength (F) are presented for healthy controls (HCs; black) and DMD patients (red). TV, CV, specific strength, and pinch strength were lower in DMD patients. T2water was higher compared with HCs, while FF was only slightly elevated. Statistical significance was set at P < 0.05. Uncorrected P values are reported and statistical significance after Bonferroni–Holm correction is shown by *.
