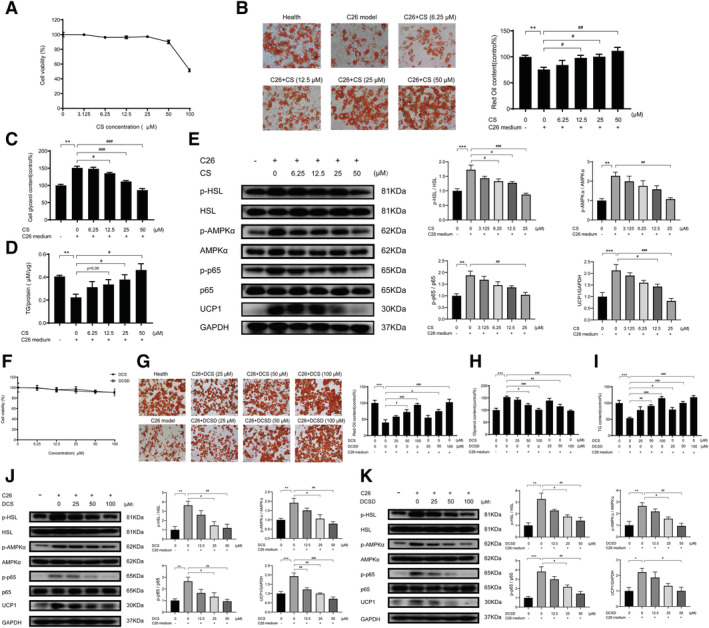
Figure 2.

Effects of CS, DCS, and DCSD on lipolysis of 3T3‐L1 adipocyte in vitro. 3T3‐L1 pre‐adipocytes cells were differentiated into 3T3‐L1 mature adipocyte for 6 days using differentiation medium. The lipolysis of 3T3‐L1 mature adipocyte was induced by C26‐tumour medium (1:1 dilution with fresh normal medium) and treated at the same time with different concentrations of CS, DCS, or DCSD, respectively for 48 h. (A) Effects of CS on the survival rate of 3T3‐L1 mature adipocytes. (B) Oil Red O stained lipid droplets to detect the effect of CS on the lipolysis of 3T3‐L1 mature adipocyte induced by C26‐tumour medium. Scale bar, 50 μm. (C) Levels of free glycerol released in the 3T3‐L1 mature adipocyte induced by C26‐tumour medium with or without treatment of CS. (D) Concentrations of TG in the 3T3‐L1 mature adipocyte induced by C26‐tumour medium with or without treatment of CS. (E) Representative western blotting and quantification of phosphorylated HSL, total HSL, phosphorylated AMPK, total AMPK, phosphorylated p38 MAPK, total p38 MAPK, and UCP1 in the lipolysis of 3T3‐L1 mature adipocyte induced by C26‐tumour medium with or without treatment of CS. (F) Effects of DCS and DCSD on the survival rate of 3T3‐L1 adipocytes. (G) Oil Red O stained lipid droplets to detect the effect of DCS or DCSD on the lipolysis of 3T3‐L1 mature adipocyte induced by C26‐tumour medium. Scale bar, 50 μm. (H) Levels of glycerol released in the 3T3‐L1 mature adipocyte induced by C26‐tumour medium with or without treatment of DCS or DCSD. (I) Concentration of TG in the 3T3‐L1 mature adipocyte induced by C26‐tumour medium with or without treatment of DCS or DCSD. (J, K) Representative western blotting and quantification of phosphorylated HSL, total HSL, phosphorylated AMPK, total AMPK, phosphorylated p38 MAPK, total p38 MAPK, and UCP1 in the lipolysis of 3T3‐L1 mature adipocyte induced by C26‐tumour medium with or without treatment of DCS or DCSD. Data presented are the mean ± SEM of three independent experiments. *vs. control group; #vs. C26‐tumour medium. ***P < 0.01, ***P < 0.001, #P < 0.05, ##P < 0.01, ###P < 0.001.
