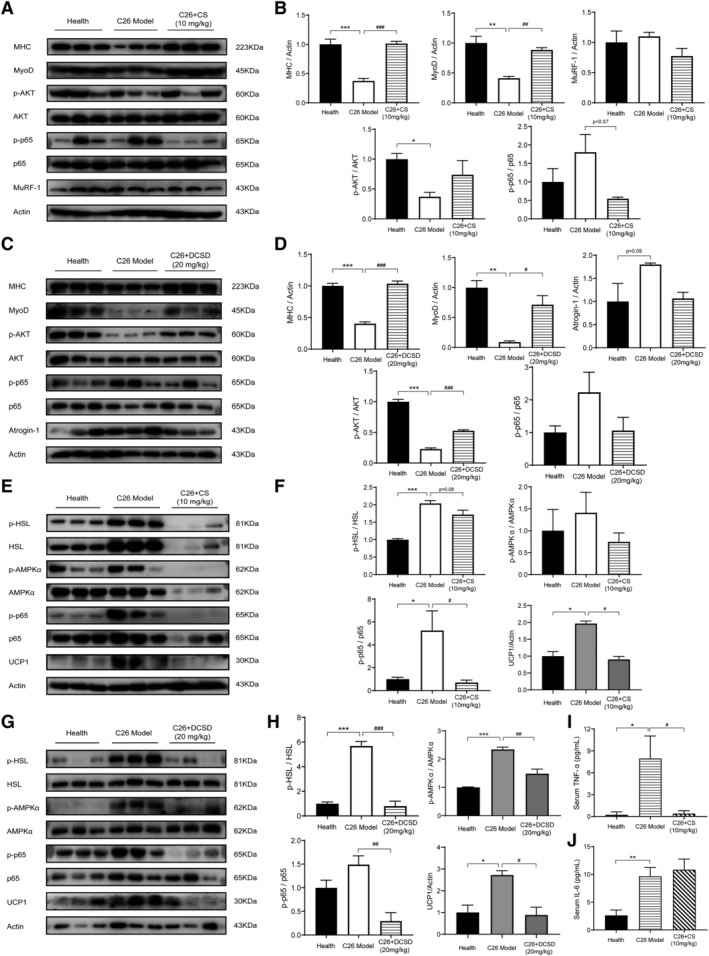
Figure 7.

CS and DCSD affected NF‐κB and related pathways in the GA and eWAT and serum levels of inflammatory cytokines. GA and eWAT were freshly isolated and homogenized by a tissue lyser in RIPA buffer at the end of the animal experiment. The protein expression levels in GA and eWAT were measured with western blotting analysis. (A) Representative Western blotting of MHC, MyoD, MuRF‐1, phosphorylated AKT, total AKT, phosphorylated p65, and total p65 in the GA tissues with or without treatment of CS. (B) The quantification of panel (A). (C) Representative western blotting of MHC, MyoD, MuRF‐1, phosphorylated AKT, total AKT, phosphorylated p65, and total p65 in the GA tissues with or without treatment of DCSD. (D) The quantification of panel (C). (E) Representative western blotting of phosphorylated HSL, total HSL, phosphorylated AMPKa, total AMPKa, phosphorylated p65, total p65, and UCP1 in the eWAT tissue of mice with or without treatment of CS. (F) The quantification of panel (E). (G) Representative western blotting of phosphorylated HSL, total HSL, phosphorylated AMPKa, total AMPKa, phosphorylated p65, total p65, and UCP1 in the eWAT tissue of mice with or without treatment of DCSD. (H) The quantification of panel (G). (I, J) Serum level of TNF‐α and IL‐6 with or without treatment of CS. Values are expressed as mean ± SEM (n = 3). *vs. health group mice; #vs. C26 tumour‐bearing group mice. One‐way ANOVA test was performed followed by Bonferroni's post hoc test. *P < 0.05, **P < 0.01, ***P < 0.001, #P < 0.05, ##P < 0.01, ###P < 0.001.
