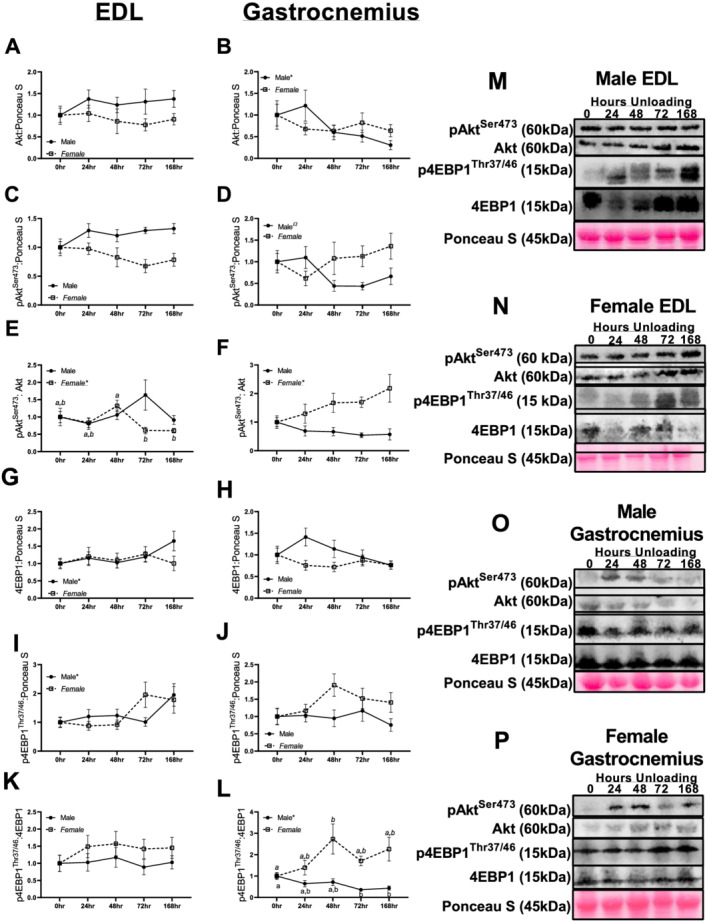
Figure 3.

Immunoblot data for marks of protein synthesis in males and females across different durations of unloading. (A) Akt protein content in the extensor digitorum longus (EDL) of males and females across different durations of unloading. (B) Akt protein content in the gastrocnemius of males and females across different durations of unloading. (C) pAktSer473 protein content in the EDL of males and females across different durations of unloading. (D) pAktSer473 protein content in the gastrocnemius of males and females across different durations of unloading. (E) pAktSer473:Akt protein ratio in the EDL of males and females across different durations of unloading. (F) pAktSer473:Akt protein ratio in the gastrocnemius of males and females across different durations of unloading. (G) 4EBP1 protein content in the EDL of males and females across different durations of unloading. (H) 4EBP1 protein content in the gastrocnemius of males and females across different durations of unloading. (I) p4EBP1Thr37/46 protein content in the EDL of males and females across different durations of unloading. (J) p4EBP1Thr37/46 protein content in the gastrocnemius of males and females across different durations of unloading. (K) p4EBP1Thr37/46:4EBP1 protein ratio content in the EDL of males and females across different durations of unloading. (L) p4EBP1Thr37/46:4EBP1 protein ratio content in the gastrocnemius of males and females across different durations of unloading. (M) Representative images for EDL immunoblot data in males. (N) Representative images for EDL immunoblot data in females. (O) Representative images for gastrocnemius immunoblot data in males. (P) Representative images for gastrocnemius immunoblot data in females. Different letters represent statistical differences at Tukey‐adjusted P ≤ 0.05. *Linear trend within a sex. ΩQuadratic trend within a sex. #Cubic trend within a sex. Female data are italicized and underlined.
