Fig. 1.

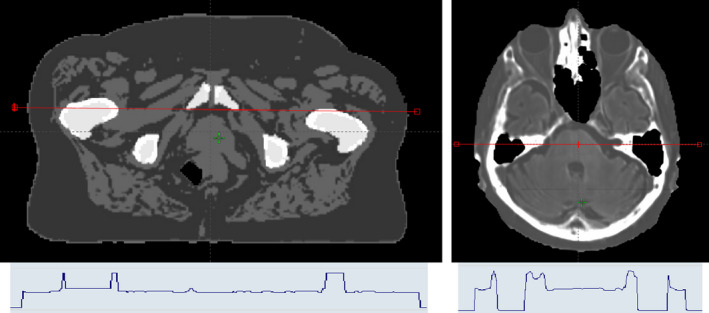
Example of s‐CT images obtained for the pelvis (Left) and the brain (Right) with a HU profile (red line on the s‐CT) stressing the segmented (left) and continuous (right) HU affectation.

Example of s‐CT images obtained for the pelvis (Left) and the brain (Right) with a HU profile (red line on the s‐CT) stressing the segmented (left) and continuous (right) HU affectation.