Fig. 6.

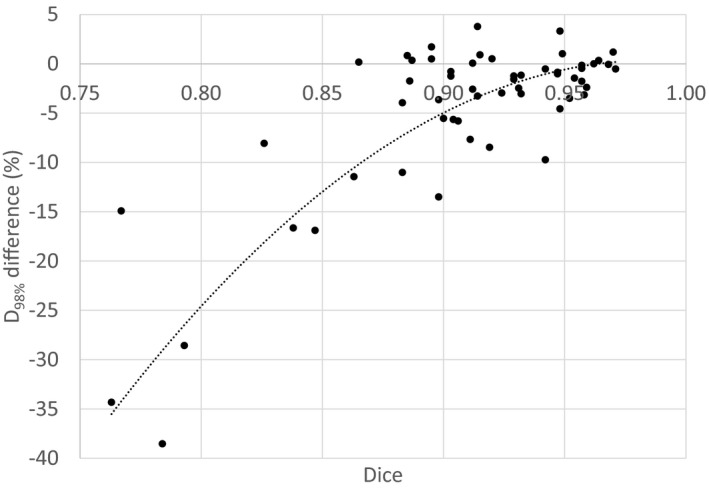
Difference on the D98% between the s‐CT and CT represented as a function of the DICE. Each point represents a plan associated to a PTV (either prostate, prostate and seminal vesicles or pelvis). Dashed line represents a two order polynomial.

Difference on the D98% between the s‐CT and CT represented as a function of the DICE. Each point represents a plan associated to a PTV (either prostate, prostate and seminal vesicles or pelvis). Dashed line represents a two order polynomial.