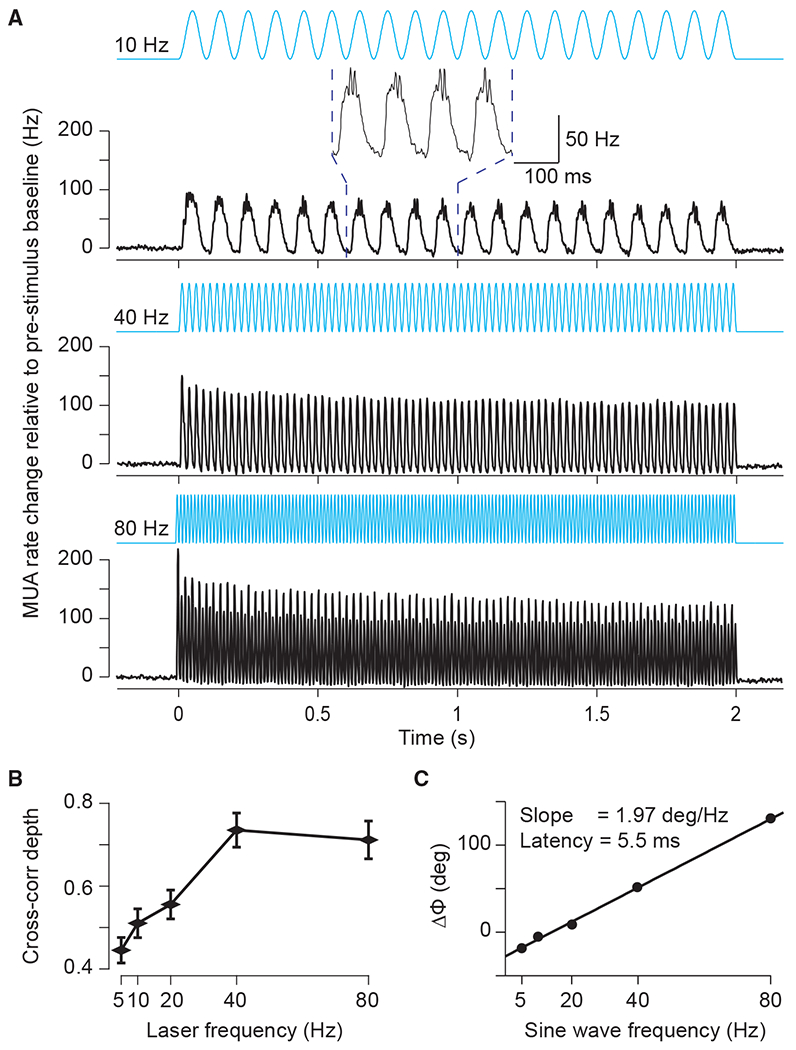
Figure 3. MUA responses to sinusoidal stimulation.

(A) MUA spike density (Gaussian smoothing with σ = 1.25 ms and truncated at ±2σ) for 10- (top), 40- (middle), and 80-Hz (bottom) sinusoidal stimulation, respectively. The inset shows an enlarged version of a few cycles to illustrate the gamma-band resonance induced at the peak of the depolarizing phase of the 10-Hz sinusoid. Data were baseline subtracted (−0.5 to 0 s) and averaged over all MUA recording sites (n = 60 in 4 cats). Error regions for ±1 SEM across recording sites are smaller than line width.
(B) Modulation depth quantified as peak-to-trough distance of the Pearson cross-correlation coefficient as function of the frequency of stimulation.
(C) Peak latency from stimulation to MUA response as a function of frequency. The text inset gives the slope and the corresponding latency between optogenetic stimulation and neuronal response.
