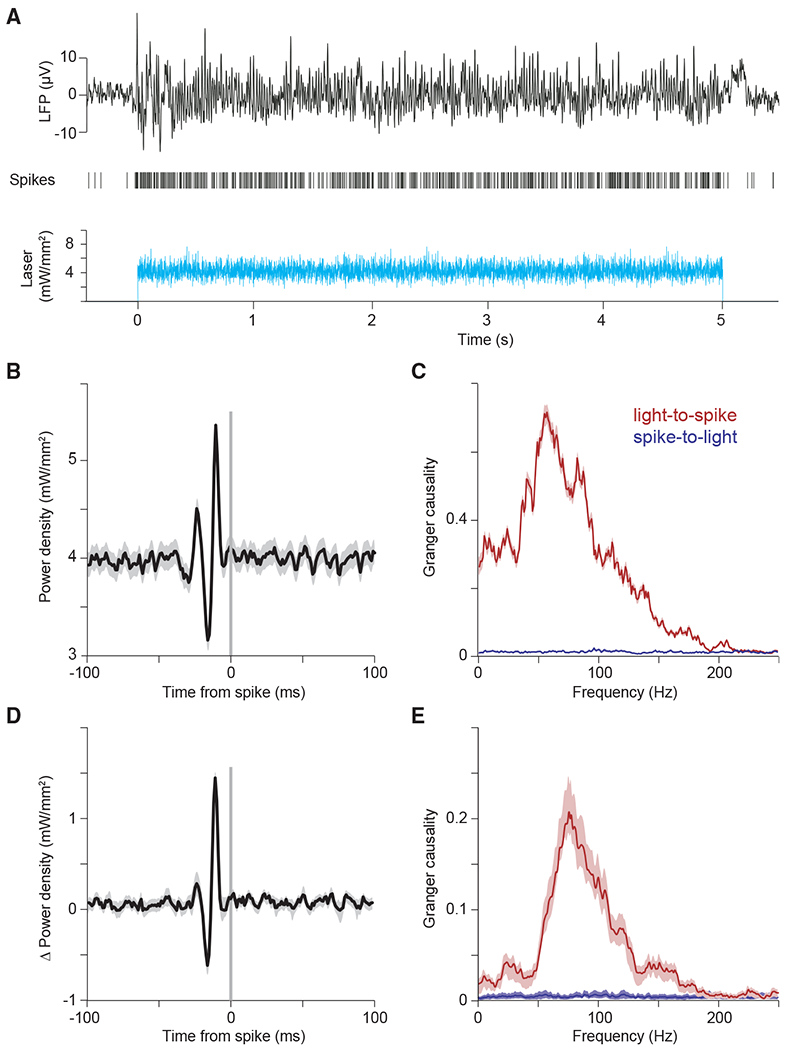
Figure 4. The component of white-noise stimulation coherent with network resonance is transmitted as MUA.

(A–C) Example single-trial LFP and MUA response to optogenetic white-noise stimulation. The bottom panel shows the white-noise time course of laser intensity. The sequence of vertical lines above it indicates time points of MUA spike occurrence. The black continuous line on top shows the LFP. (B) Spike-triggered average (STA) of laser power density, triggered by the spikes recorded at one example recording site. (C) Granger causality (GC) spectrum for the data shown in (B). Red line shows GC from light to spikes; blue line shows GC from spikes to light (as control).
(D and E) Same as (B) and (C), but for the average across recording sites (n = 13 sites in 3 cats).
