
Figure 3.
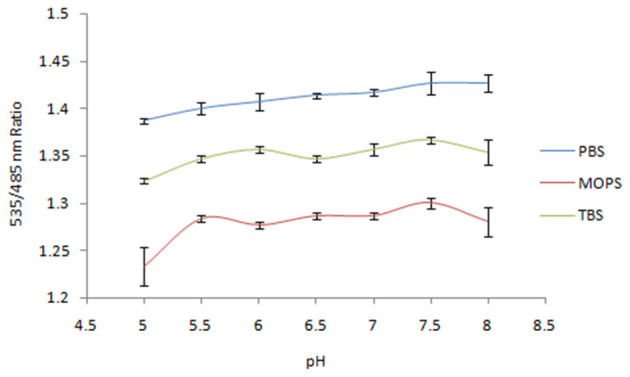
Sensitivity analysis of nanosensor toward pH in different buffer systems. The data are the average of three replications. Vertical bars show the standard errors. 0.20 mg/ml sensor protein was taken.
Official websites use .gov
A
.gov website belongs to an official
government organization in the United States.
Secure .gov websites use HTTPS
A lock (
) or https:// means you've safely
connected to the .gov website. Share sensitive
information only on official, secure websites.
Sensitivity analysis of nanosensor toward pH in different buffer systems. The data are the average of three replications. Vertical bars show the standard errors. 0.20 mg/ml sensor protein was taken.