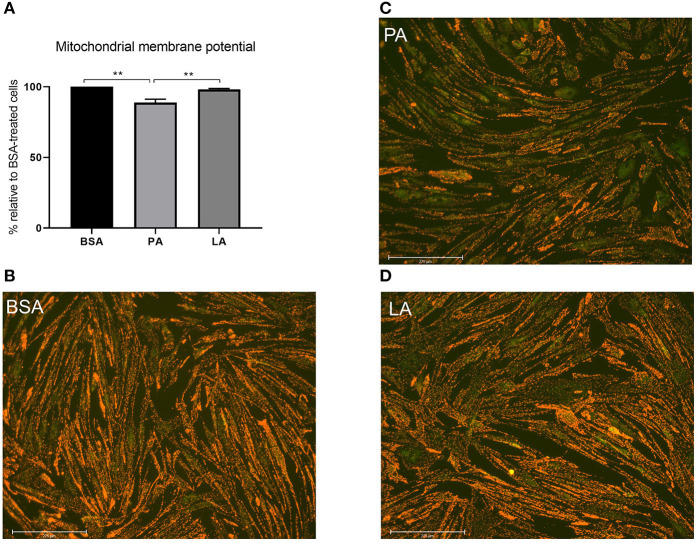
Figure 4.
The impact of palmitic and lauric acid on mitochondrial membrane potential. (A) Mitochondrial membrane potential calculated as red to green JC-1 fluorescence ratio. Representative images of JC-1–derived red and green fluorescence of myotubes treated with BSA (B), PA (C), and LA (D). Scale bar = 275 μM. Data are reported as means ± SEM, n = 4 cultures from independent donors (means of three replicates). **P < 0.01.

