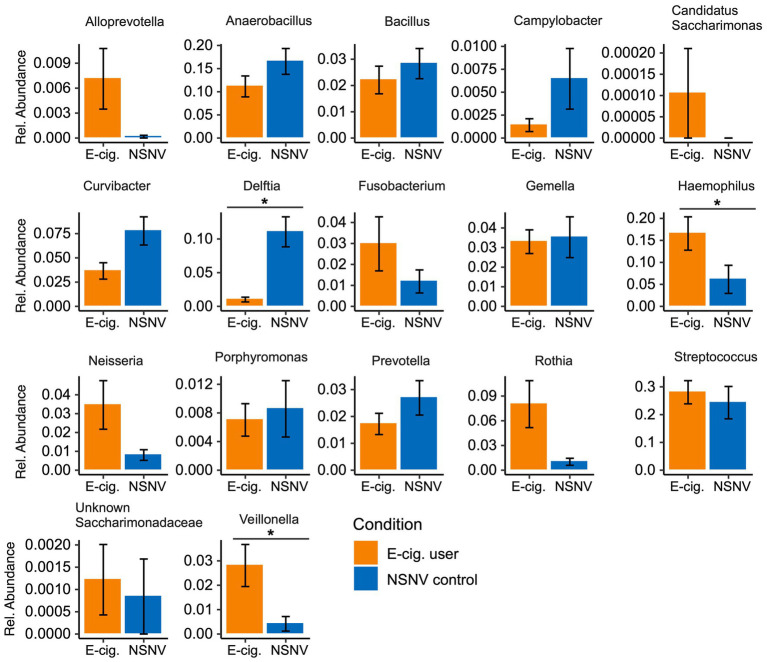
Figure 4.
Bar charts of the relative abundance (±SE) of the dominant bacterial community taxa present in e-cigarette users and NSNV controls for buccal samples. For each of the dominant bacterial taxa, the relative abundance is listed on the y-axis and the e-cigarette status (E-cigarette users, orange; NSNV controls, blue) is on the x-axis. Significant difference (p < 0.05) determined by an unpaired two-sample Wilcoxon test with FDR correction.

