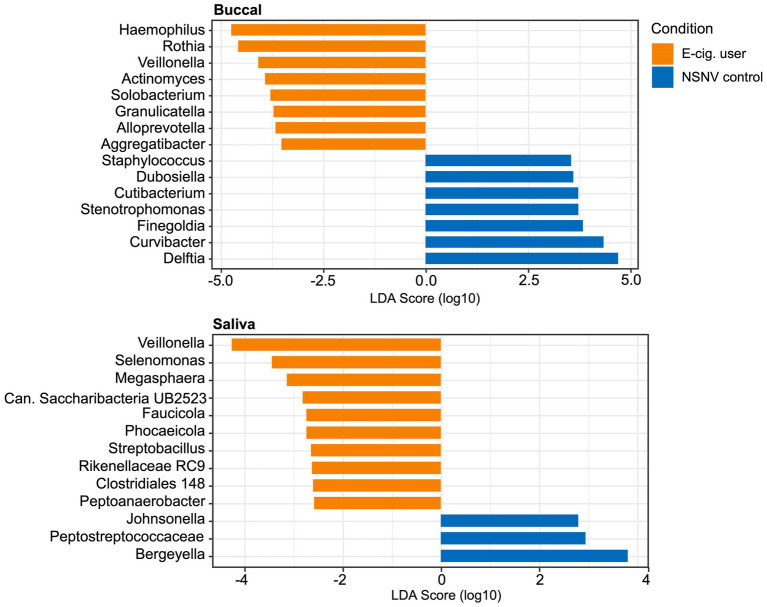
Figure 5.
Linear discriminant analysis (LDA) scores (α = 0.05, LDA score > 2.0) computed for differentially abundant bacterial taxa between e-cigarette users and NSNV controls from buccal and saliva samples. The log10 transformed LDA scores are showed on the x-axis and the bacterial taxa are listed on the y-axis. Orange bars indicate the taxa found in greater relative abundance in e-cigarette users. Blue bars indicate taxa found in greater relative abundance in NSNV controls.

