
Figure 6.
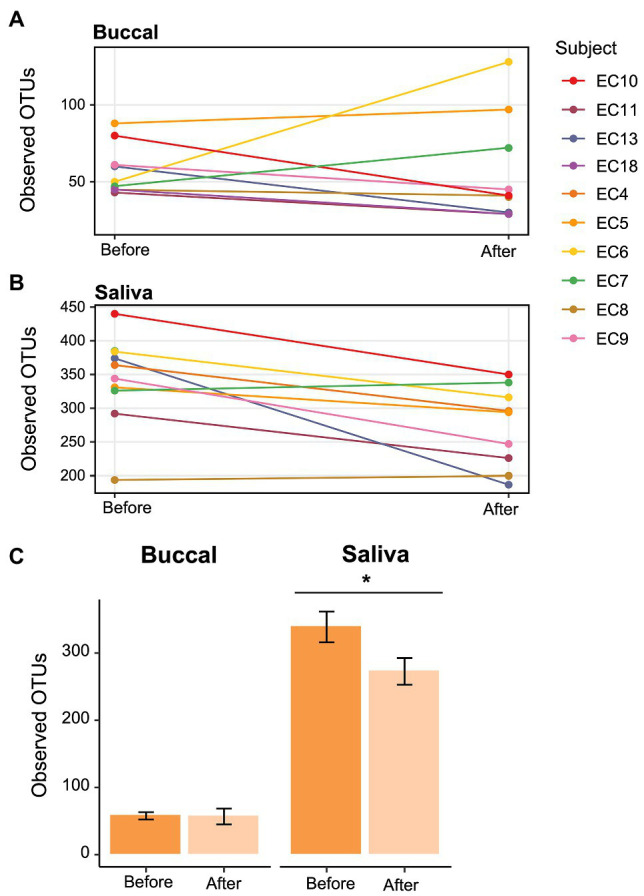
Change in alpha diversity in e-cigarette users at each visit. (A,B) Line graph showing the number of Observed OTUs from (A) buccal and (B) saliva samples collected from e-cigarette users before and after reduction in vaping. The Observed OTUs are shown on the y-axis and the time before and after reduction in vaping on the x-axis. (C) Bar plots showing the aggregate data (±SE) before and after reduction in product use for buccal and saliva samples. Significance (p < 0.05) determined by a paired two-sample Wilcoxon test.