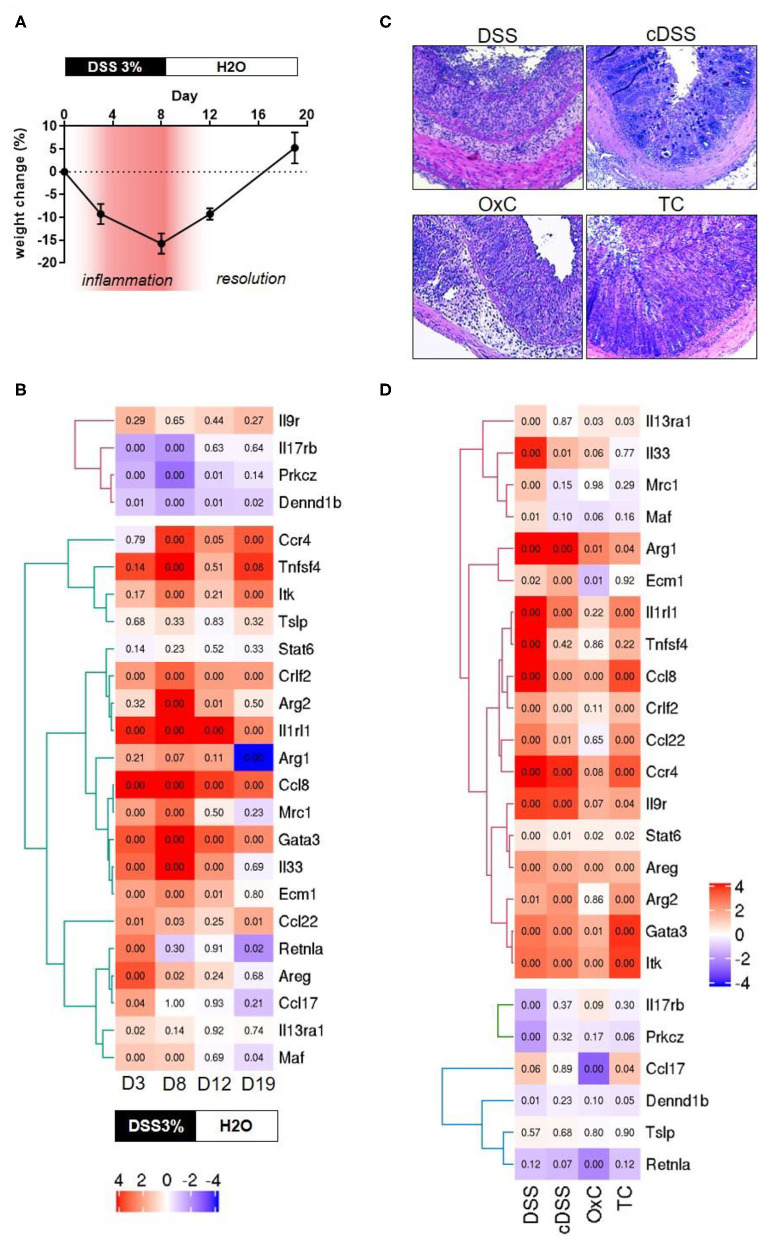
Figure 1.
Transcriptomic analyses of type 2 identifiers in multiple mouse models of colitis. (A) percent change in body weight from baseline and DSS treatment paradigm. Time points representing inflammation are represented in red (B) Heatmap depicting the normalized expression of the indicated genes from four different time-points of dextran sulfate sodium (DSS) induced colitis D3 = day 3, D8 = day 8, D12 = day 12, and D19 = day 19. The text boxes below represent the treatment type and duration. Hierarchical clustering shows clear segregation of two distinct groups of genes. (C) Representative photomicrographs of H&E-stained tissue sections from the indicated colitis mouse models. DSS, acute dextran sulfate sodium colitis; cDSS, chronic dextran sulfate sodium colitis; OxC, Oxazolone induced colitis; TC, T-cell adoptive transfer colitis. (D) Heatmap showing normalized expression levels of the indicated genes the type of regimen used to induce colitis is depicted below. Numbers in each quadrant represent the p-value and the legend denotes the fold changes in expression ratios.

