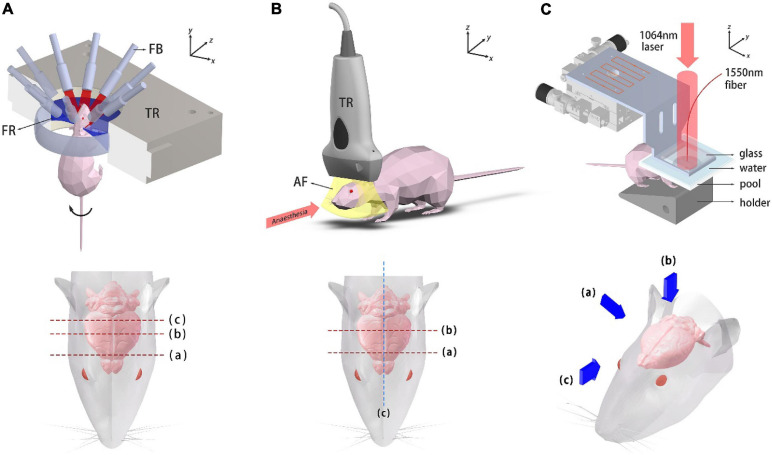
FIGURE 2.
Schematic diagrams of the imaging systems. (A) Ring-array PACT system and top view of the mouse head. Dashed lines label the imaged coronal plane positions. TR, transducer array; FB, fiber bundle; FR, focusing region. (B) System setup of the USI system and top view of the mouse head. Dashed lines label the imaged coronal plane positions. TR, transducer probe; AF, acoustic focal plane. (C) Photoacoustic mesoscopy system and three viewing perspectives, which are presented with blue arrows.

