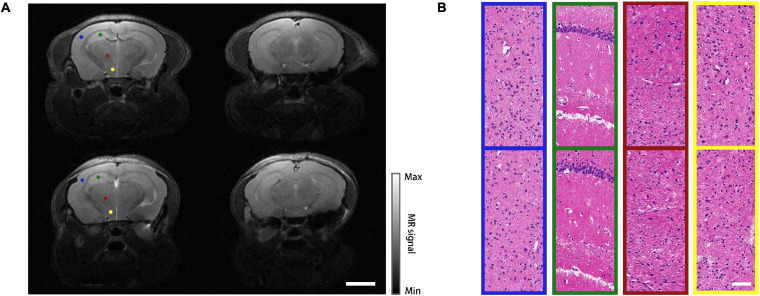
FIGURE 3.
MRI and histopathology results. (A) MRI images of a normal mouse (top row) and a modeled mouse (bottom row), left column shows midbrain, right column shows hindbrain. Scale bar = 3 mm. (B) H&E stained images of different regions in midbrain coronal plane. Top row: normal mouse; bottom row: mouse model. The sampling regions of these images are represented as color-coded dots in (A). Scale bar = 80 μm.

