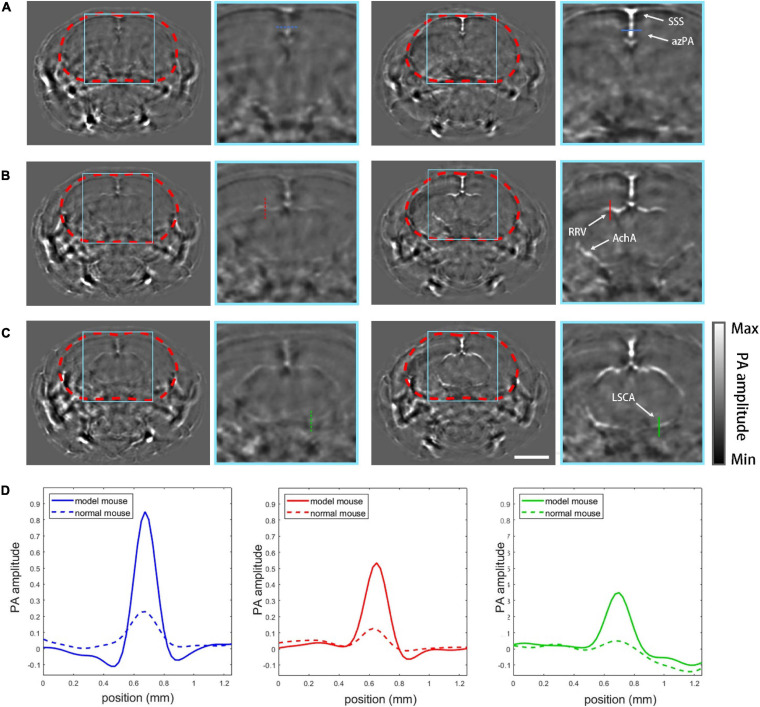
FIGURE 4.
PACT imaging results. (A) PACT images of plane (a, Figure 2A) with zoomed-in views of normal mouse (left column) and the mouse model (right column). SSS, superior sagittal sinus; azPA, azygos pericallosal artery. (B) Images of plane (b, Figure 2A): RRV, rostral rhinal vein; AchA, anterior choroidal artery. (C) Images of plane (c, Figure 2A): LSCA, lateral superior cerebellar artery. (D) Profiles of the vessels marked in the PACT images by different colors. Scale bar = 3mm.

