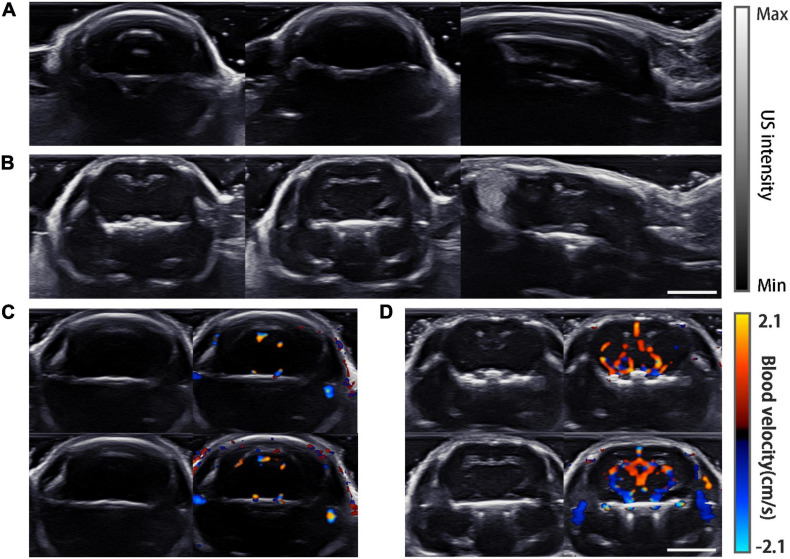
FIGURE 5.
USI imaging results. (A) Gray-scale images of a normal mouse, from left to right are plane (a–c) which are shown in Figure 2B. (B) Gray-scale images of the mouse model imaged at the same planes as in (A). (C) Doppler images of the normal mouse. Gray-scale images are displayed on the left. Two different layers are shown in the top and bottom rows. (D) Doppler images of the mouse model at the same planes of (C). Scale bar = 5 mm.

