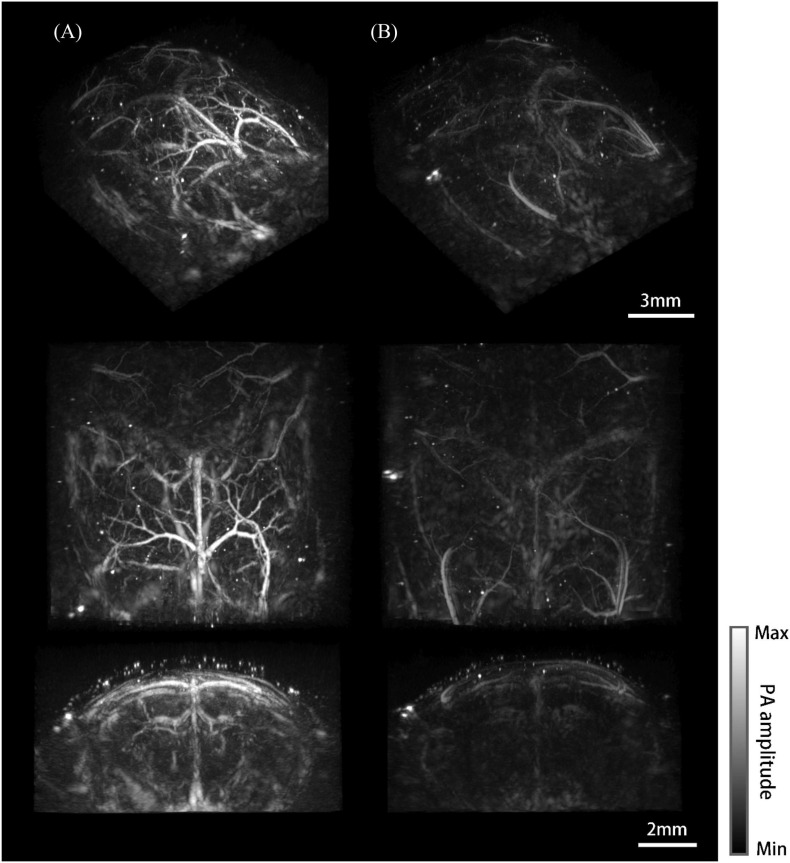
FIGURE 7.
Photoacoustic mesoscopy system and imaging results. (A) Whole-brain imaging results of the mouse model. From top to bottom are the maximum intensity projections (MIP) of the viewing perspective (a–c) shown in Figure 2C, respectively. (B) Imaging results of the normal mouse.

